
Commodities continue to exhibit marked price sensitivity to headline news as the economic recovery from Covid-19 continues. Positive news on vaccines has generated a significant rally in oil prices, but in the near term we expect the demand impact from the pandemic to be a headwind, limiting the scope for further upside. We maintain that the "Phase-One" agreement between the United States and China was positive for global trade and believe that China is likely to continue to act in good faith to fulfill purchase commitments. Fundamentally, we believe that supply growth in most commodities will be limited because of the harm suppliers have suffered during this year’s Covid-driven downturn. But in the absence of material global demand destruction, moderate growth should, we believe, lead to improved supply and demand fundamentals across commodities over the coming year.
OPEC+ and other oil-producing nations have begun to bring crude supply back to the market. This, however, is happening gradually in order to account for the slow recovery in global demand. Regardless of the pace of recovery, it will take considerable restraint by OPEC+ to bring inventory levels down to historical averages. The oil market's health will probably largely depend on the extent of future demand recovery from the coronavirus epidemic. Positive news on the vaccine front certainly brightens the outlook. For West Texas Intermediate (WTI) [1] we expect a price of 49 USD per barrel by December 2021.
For natural gas our view is that prices will continue to be volatile, moving in synchrony with weather forecasts for the winter season. Lately, U.S. natural gas has fallen significantly as the two-week weather forecast has been trending toward warmer weather for the United States.
Overall, investor interest in gold has softened in the face of the risk rally driven by positive vaccine trials and rollout optimism. The outperformance of base metals over precious metal continues to reflect investors' preference for assets that benefit from a cyclical recovery. Copper prices, for example, have been propelled by Chinese restocking. The Covid-19 recovery and global infrastructure spending could also help copper. Gold appears to have found support at the 1,800 dollars-per-ounce level. Central banks continue to affirm "lower-for-longer" interest-rate policies globally. With the U.S. Federal Reserve (the Fed) moving toward targeting an average inflation rate and signaling a willingness to keep inflation above the 2% target for some time, we expect investors to continue to add gold to their portfolios as a hedge against unexpected sharp rises in inflation. Despite the positive vaccine news, we therefore consider it likely that gold prices could reach 2,100 dollars per ounce by December 2021, an increase of around 12% on their current level.
Across the agricultural complex, we think dollar fluctuations are likely to continue to drive investment flows. Global importers, including China, are in need of corn and soybeans from the United States through at least January, pointing to strong export demand regardless of currency fluctuations. The currently tight inventory numbers from the U.S. Department of Agriculture should go a long way toward supporting elevated crop prices. We believe the market's attention will be on South American production, where we see little room for supply disappointments. The risk-reward balance looks bullish, particularly for corn and soybeans, but the direction of prices from here will be very weather dependent in our view. We feel that wheat is fundamentally overvalued and likely to underperform, while softs face considerable supply uncertainty and are likely to remain volatile.
Past 30-day and year-to-date performance of major commodity classes
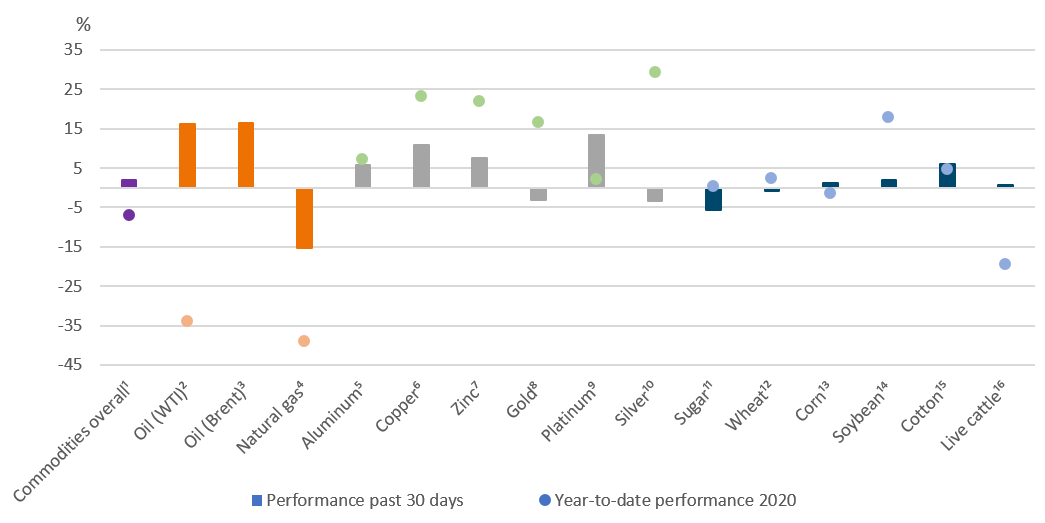
Past performance is not indicative of future returns.
Sources: Bloomberg Finance L.P., DWS Investment Management Americas Inc. as of 12/15/20
¹Bloomberg Commodity Index ²Bloomberg WTI Crude Oil Subindex ³Bloomberg Brent Crude Subindex ⁴Bloomberg Natural Gas Subindex ⁵Bloomberg Aluminum Subindex ⁶Bloomberg Copper Subindex ⁷Bloomberg Zinc Subindex ⁸Bloomberg Gold Subindex ⁹Bloomberg Platinum Subindex ¹⁰Bloomberg Silver Subindex ¹¹Bloomberg Sugar Subindex ¹²Bloomberg Wheat Subindex ¹³Bloomberg Corn Subindex ¹⁴Bloomberg Soybeans Subindex ¹⁵Bloomberg Cotton Subindex ¹⁶Bloomberg Live Cattle Subindex
Appendix: Performance over the past 5 years (12-month periods)
|
|
11/15 - 11/16 |
11/16 - 11/17 |
11/17 - 11/18 |
11/18 - 11/19 |
11/19 - 11/20 |
|
Bloomberg Commodity Index |
6.1% |
-0.3% |
-3.7% |
-6.6% |
-3.6% |
|
Bloomberg WTI Crude Oil Subindex |
-14.8% |
5.4% |
-7.8% |
5.7% |
-48.9% |
|
Bloomberg Brent Crude Subindex |
-4.9% |
14.1% |
-0.9% |
8.7% |
-30.4% |
|
Bloomberg Natural Gas Subindex |
-0.7% |
-27.3% |
41.0% |
-57.6% |
-35.7% |
|
Bloomberg Gold Subindex |
8.9% |
6.9% |
-6.5% |
16.8% |
17.1% |
|
Bloomberg Silver Subindex |
14.8% |
-2.3% |
-16.2% |
16.3% |
27.2% |
|
Bloomberg Platinum Subindex |
8.5% |
2.1% |
-16.7% |
9.6% |
4.7% |
|
Bloomberg Copper Subindex |
26.3% |
13.0% |
-11.9% |
-5.7% |
26.1% |
|
Bloomberg Aluminum Subindex |
16.2% |
14.8% |
-3.6% |
-13.3% |
9.1% |
|
Bloomberg Zinc Subindex |
69.4% |
16.1% |
-16.3% |
-6.0% |
20.0% |
|
Bloomberg Corn Subindex |
-14.2% |
-10.8% |
-7.1% |
-9.4% |
0.7% |
|
Bloomberg Wheat Subindex |
-26.1% |
-11.0% |
2.6% |
1.3% |
3.5% |
|
Bloomberg Soybeans Subindex |
16.3% |
-9.2% |
-15.4% |
-10.5% |
26.4% |
|
Bloomberg Sugar Subindex |
26.9% |
-27.6% |
-22.2% |
-9.9% |
7.0% |
|
Bloomberg Cotton Subindex |
12.8% |
1.9% |
7.3% |
-20.7% |
6.9% |
|
Bloomberg Live Cattle Subindex |
-8.0% |
15.2% |
-4.9% |
2.1% |
-19.9% |
Past performance is not indicative of future returns.
Sources: Bloomberg Finance L.P., DWS Investment GmbH as of 12/15/20.


