
The tumultuous start to the new decade might be a harbinger for an eventful year. A U.S. drone strike killed the commander of the Iranian Quds force, General Quasem Soleimani, in Iraq. Responses appeared to be calibrated to allow both sides to gradually ramp down tensions again.
After the initial spike, the oil price dropped significantly as investors' focus shifted back to supply-and-demand concerns. Other commodities have not reacted much to the attacks. We do not expect that to change unless we see significant escalation going forward.
We saw another oil-price disruption after local Libyan tribes blocked oil transportation to the Zawiya export terminal in mid-January. For the conflict in Libya, we anticipate the outage to be temporary, as both sides of the Libyan forces share strong incentives to resume exporting. Even though the disruption represents a swing of one million barrels per day, the market appears to be more focused on risk-off and a potential repricing due to weaker demand growth once again.
We reiterate our weaker one-year outlook for oil prices as supply from Norway and Brazil to Guyana threaten OPEC's endeavor to stabilize the oil market. Although moderate global growth supports demand, we believe that supply growth is derailing the cartel's efforts. We stick to our West-Texas-Intermediate (WTI) forecast of 54 U.S. dollars per barrel.
And while the oil market operates on an inventory strategy, participants in the natural-gas market aim to maintain market share. Qatar's very vocal commitment to preserve market share and match U.S. production increases one to one does not point to any market stabilization in the near future. We believe that natural-gas prices look set to stay depressed. China's commitment to opening the upstream gas market to foreign direct investment might enlighten gas-producing companies, but could at the same time contribute to more supply. Moreover, mild weather across most of the United States only exacerbates the supply surplus. Russia and Ukraine reached a transit deal, assuring the European gas market of further uninterrupted supply. Simultaneously, the United States signed sanctions against the pipeline. This, however, is not likely to reverse the downward trend in prices.
During the past weeks the gold price has held up fairly well, despite progress on the trade front. Our view is that the gold price will likely remain elevated as investor flow into gold continues. In the coming months, we believe there are several other macro events such as the U.S.-China trade conflict, Brexit, Trump impeachment, and the U.S. election that might continue to weigh on investor sentiment and provide support for the gold price even as the acute conflict with Iran de-escalates. In light of heightened geopolitical risks, we expect the gold price to stay elevated. Similarly, we maintain our positive outlook for palladium despite the market volatility in December. Market fundamentals remain unchanged and we expect the demand for palladium to remain strong. In particular, automobile catalytic converters' key component is palladium. Increasing environment-friendly regulation therefore supports the demand for that commodity [for more details: DWS CIO Commodity Commentary as of 12/18/19].
The signing of the phase-one deal between the United States and China has certainly helped base metals. Copper – one of the most sensitive metals to the state of the Chinese economy – has climbed significantly on the hopes of a rebound in copper demand. It hit the highest level since May last year. Recent quarterly / semi-annual reports confirmed that metals-and-mining companies' continue to focus on cash flow and paying dividends rather than capital spending for growth. While this should prove supportive for supply-and-demand balances in the future, we are skeptical whether the U.S.-China deal will have a substantial impact on the demand dynamics for base metals and, for now, expect base-metal prices to slow until after the Chinese New Year.
On the agricultural front, the focus is now on South America as the harvest season begins. Brazil, as a major ethanol consumer, is very dependent on the key ingredient sugar, which is very sensitive to weather conditions. Brazilian sugar mills crushed less cane in the second half of 2019 compared to the year before. The resulting lower supply together with Brazil's increasing demand for ethanol as a more sustainable substitute for other fuels could provide support for sugar. Corn, another key ingredient for ethanol, might similarly benefit from increased demand, hence our positive outlook on both commodities.
Then there is the phase-one trade deal, in which Chinese authorities have agreed to increase their agricultural purchases by 32 billion U.S. dollars annually over the next two years. While Brazilian soybean prices increased this past year due to the trade war, we believe they will still be critical in a post-phase-one-deal world. This is true especially during the start of the year when the harvesting season takes place in South America and the United States is not harvesting soybeans. In that part of the year China would mainly rely on production from South America as it did in a pre-phase-one-deal world year round. In the second half of the year, the United States will add to supply as harvesting takes place. This would essentially represent pre-trade-war dynamics.
What else did the "beautiful monster"[1] have to offer? Farmers certainly welcomed the signing of the phase-one trade deal as it alleviated the burden on American farmers. We remain, however, skeptical if China is able to meet the purchase targets, especially as specific targets for individual commodities have not been revealed.
Past 30-day and year-to-date performance of major commodity classes
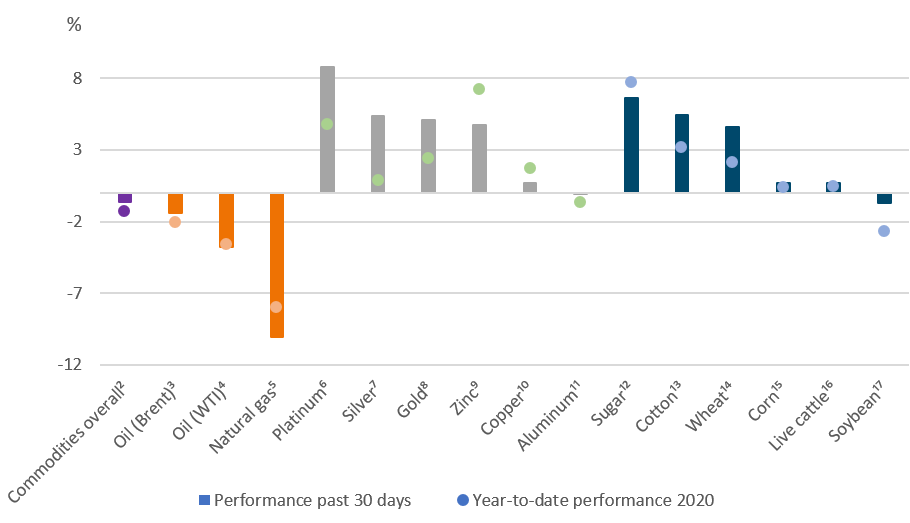 Sources: Bloomberg Finance L.P., DWS Investment Management Americas Inc. as of 1/20/20
2Bloomberg Commodity Index, 3Bloomberg Brent Crude Subindex, 4Bloomberg WTI Crude Oil Subindex, 5Bloomberg Natural Gas Subindex, 6Bloomberg Platinum Subindex, 7Bloomberg Silver Subindex, 8Bloomberg Gold Subindex, 9Bloomberg Zinc Subindex, 10Bloomberg Copper Subindex, 11Bloomberg Aluminum Subindex, 12Bloomberg Sugar Subindex, 13Bloomberg Cotton Subindex, 14Bloomberg Wheat Subindex, 15Bloomberg Corn Subindex, 16Bloomberg Live Cattle Subindex, 17Bloomberg Soybeans Subindex
Appendix: Performance over the past 5 years (12-month periods)
|
|
12/14 - 12/15 |
12/15 - 12/16 |
12/16 - 12/17 |
12/17 - 12/18 |
12/18 - 12/19 |
|
Bloomberg Commodity Index |
-24.7% |
11.4% |
0.7% |
-13.0% |
5.4% |
|
Bloomberg WTI Crude Oil Subindex |
-44.4% |
6.7% |
4.1% |
-22.0% |
31.6% |
|
Bloomberg Brent Crude Subindex |
-45.6% |
25.0% |
13.2% |
-16.6% |
32.7% |
|
Bloomberg Natural Gas Subindex |
-40.0% |
10.0% |
-37.0% |
-2.1% |
-38.5% |
|
Bloomberg Gold Subindex |
-10.9% |
7.4% |
11.7% |
-4.7% |
15.6% |
|
Bloomberg Silver Subindex |
-12.8% |
13.6% |
4.8% |
-11.9% |
11.5% |
|
Bloomberg Platinum Subindex |
-26.5% |
0.4% |
2.0% |
-16.5% |
19.0% |
|
Bloomberg Copper Subindex |
-25.2% |
15.4% |
28.0% |
-22.8% |
5.0% |
|
Bloomberg Aluminum Subindex |
-23.0% |
9.4% |
29.9% |
-18.5% |
-5.8% |
|
Bloomberg Zinc Subindex |
-28.0% |
56.9% |
28.5% |
-22.9% |
-3.2% |
|
Bloomberg Corn Subindex |
-19.3% |
-10.1% |
-12.9% |
-6.5% |
-7.2% |
|
Bloomberg Wheat Subindex |
-22.3% |
-24.3% |
-13.3% |
1.5% |
7.1% |
|
Bloomberg Soybeans Subindex |
-14.7% |
14.5% |
-9.0% |
-13.4% |
-2.6% |
|
Bloomberg Sugar Subindex |
-4.8% |
22.4% |
-26.1% |
-27.5% |
-0.2% |
|
Bloomberg Cotton Subindex |
2.9% |
10.2% |
11.5% |
-9.1% |
-8.4% |
|
Bloomberg Live Cattle Subindex |
-14.3% |
-7.7% |
8.1% |
0.6% |
-0.9% |
Past performance is not indicative of future returns.
Sources: Bloomberg Finance L.P., DWS Investment GmbH as of 1/20/20
1. https://www.bloomberg.com/news/articles/2020-01-15/trump-poised-to-sign-beautiful-monster-of-a-deal-with-china Trump refers to the phase-one deal as "beautiful monster."