- Home »
- Insights »
- CIO View »
- Investment Traffic Lights »
- Investment Traffic Lights

- In a sharp reversal of many of the patterns we saw amidst June’s disappointments, markets in July have delivered a roaring start into the second half of 2022.
- Both U.S. equities and U.S. Treasuries delivered strong monthly returns, setting an upbeat tune for global financial markets.
- For coming weeks, though, keep in mind that liquidity is seasonally low, and there are plenty of uncertainties on macroeconomics, monetary policies and geopolitics.
1 / Market overview
After a grim first half of 2022 in terms of financial-market performance, July has delivered a roaring start into the rest of the year. As often happens at such market turning points, this had little to do with any concrete signs of good news on the various fronts that have kept investors on edge. In Southern and Eastern Ukraine, Vladimir Putin’s brutal war of attrition continued to drag on. After the annual maintenance of a key pipeline Nordstream 1, the Kremlin’s increasingly despotic ruler left Europeans guessing on gas supplies during this winter’s heating season, by partially switching them on and off again.[1] As a result of this and other supply disruptions, notably in food, short-term inflation estimates continued to be revised upwards.
In reaction, central banks have been keen to butress their inflation-fighting credentials. The U.S. Federal Reserve (Fed) delivered its second 75-basis-point interest-rate hike in as many months. Most central banks in both emerging and developed markets are now in tightening mode in our opinion. With its first interest-rate increase in 11 years, the European Central Bank (ECB) took its deposit rate to zero. It also unveiled a new anti-fragmentation instrument enabling it to put a lid, if need be, on “unwarranted, disorderly market dynamics.” It did not specify exactly what it would take, for example in terms of spreads of Italian government bonds over Germany’s Bunds, for the new tool to be deployed.[2]
A little akwardly, all this coincided with signs of slowing economic momentum. The U.S. saw its second consecutive quarter of negative growth in gross domestic product (GDP), fullfilling one of the common criteria used to demarcate technical recessions.[3] Meanwhile, Italy’s government of national unity collapsed, triggering snap elections on September 25, 2022.
1.1 Robust markets amidst all the uncertainties
None of these potentially unnerving developments could spoil the mood in global equity markets for very long. During the month of July, the S&P 500 gained more than 9%, with Europe’s Stoxx 600 up almost 8%, the MSCI AC World Index up 7%, and Germany’s Dax just under 6%.[4]
As significantly, the price gains in equity markets coincided with U.S. Treasuries also performing very well. Yields on 10-year Treasuries ended the month down 37 basis points, resulting in monthly returns of 1.7%, the best performance since March 2020, according to Deutsche Bank Research. Coming hard on the heels of the disastrous performance of mixed equity and bond portfolios during the first half of 2022 – highlighted in our July investment traffic lights[5] – it was quite a sharp reversal.
In terms of potential justifications cited by market participants, the most common one has been that interest rates may eventually be cut again, at some point in 2023. The trouble with this logic, though, is that it presupposes inflation will somehow be defeated, without causing too much collateral damage to Western economies in the process.
1.2 A mixed, and not particularly encouraging, economic outlook
Unfortunately, such hopeful readings of inflation and growth dynamics are very much at odds with many recent economic indicators. Throughout the OECD, consumer confidence hit lows in July not seen even in the darkest days of the Global Financial Crisis of 2007-2009, while high-frequency measures of economic growth pointed towards slowing momentum.[6]
Inflationary pressures, meanwhile, remain stubbornly high, not least as labor markets are still going strong. Of course, wages and employment tend to be lagging behind economic activity. It takes quite a while for labor shortages to manifest in wage growth and the same logic also tends to hold in reverse during downturns.[7] Moreover, such lags in how long it takes for labor markets to respond to economic turning points augur against pauses, let alone reversals in monetary policy any time soon. The Fed, in particular, has clearly signaled that it wishes to see signs of labor-market moderation, before it considers its job in containing inflation to be done.
1.3 Our interpretation: good old swings of the market pendulum
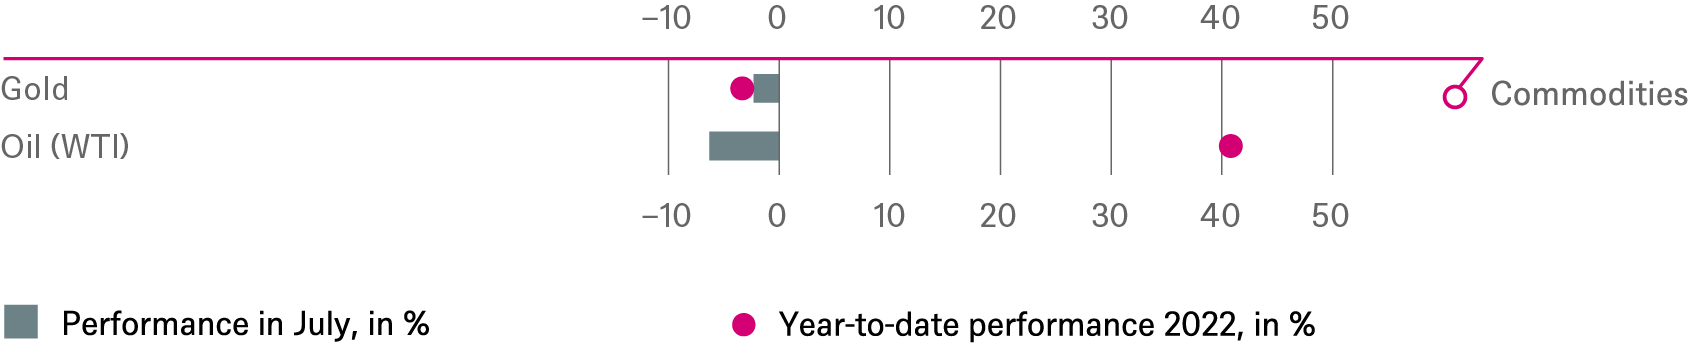
Perhaps, the explanation of recent patterns in financial markets is somewhat simpler. At least, that is what is suggested if in addition to equity and bond markets we look at the patterns in commodity and foreign-exchange markets. With the important exception of natural-gas prices, price rallies in commodities have largely stalled. Crude prices continued to see choppy trading at around $100 per barrel for Brent, compared to their March peak of almost $140. Meanwhile, gold ended the month pretty much where it started, and most agricultural commodities have been going side-ways. By contrast, base-metal prices rebounded last week, after sharp sell-offs from June to the first half of July.
Commodities – notably ones such as crude oil and copper that are key inputs to a wide variety of different sectors – have a special place as signal providers for market and macroeconomic forecasters. That is because prices usually cannot decouple from physical supply-and-demand considerations for very long. Market mistakes in one direction or the other tend to self-correct and the bigger the previous price swing, the less it takes in terms of new information to cause the market pendulum to swing back.
The same logic, we think, probably holds more broadly when we look back at July. Take foreign exchange, as another example. Against the euro, the dollar briefly strengthened beyond parity in mid-July, before weakening by about 2.7% by the end of the month. For each one of these movements, it is certainly possible to come up with some elaborate story of what particular parts of the markets are, or are not pricing in at any given point, say in terms of growth or labor-market dynamics and monetary reaction functions. A more plausible interpretation is that markets this year suffered from a bit of information overload, in the aftermath of (i) the pandemic and all the disruptions in its aftermath in both real economic activity and the collection of economic statistics[8]; (ii) Europe’s largest land war since 1945; (iii) the scrambling of central banks and other policymakers to decide how to react to these developments.
After such major changes in the environment investors find themselves in, it tends to take time and quite a bit of learning by trial and error for prices of various assets to adjust.[9] Most of the recent patterns we saw in July should, in our view, be interpreted in this light: the market pendulum swinging back in July, to make up for previous price reactions that started to look excessive. That may seem like a weak foundation to build a lasting rally on, but it will all depend on future developments. For now, we would simply point out that the encouraging trends we saw in equity markets and the prices of other risky assets in July should not be extrapolated for the rest of the year either.
2 / Outlook and changes
For coming weeks, keep in mind that liquidity is seasonally low. That would tend to accentuate price swings in case of surprises, and there are plenty of uncertainties on macroeconomics, monetary policies and geopolitics. Against this backdrop, we are mostly taking tactically cautious stances.
Russian gas supplies remain a wildcard and not just for Europe. Given how interconnected global supply chains still are, the effects of natural-gas rationing for, say, German industry, would be felt globally. Energy blackmail and trying to sow political and economic instability in nearby countries have been a typical foreign-policy tactics of the Russian Federation, arguably since the collapse of the Soviet Union and especially since Putin’s ascent to power in 2000.[10] In previously favored countries, notably Germany, Russia’s coercive diplomacy has nevertheless come as a shock. Already, this has lead to a wide range of initiatives to cut back on gas consumption. Our base case remains the Kremlin will probably continue to weaponize mutual dependency to pursue its geopolitical objectives and win concrete concessions. This, after all, is how the Russian Federation has typically used coercive gas diplomacy in the post-Soviet space, notably against Ukraine.[11] The result looks set to be lower-than-usual gas supplies, with taps for various pipelines being continuously turned on and off, but no sufficiently long supply interruption to cause potentially economically devasting rationing measures for European industries.
2.1 Fixed Income
After July’s long-awaited relief in credit markets, bargains have become harder to spot. For now, we tactically like euro high yield (HY), mainly because it has been lagging as funds flowed into the U.S.-dollar HY market and out of euro HY. New issuance remained well below typical levels across both markets in July. By contrast, we see little upside in U.S. investment grade, either from a tactical or a strategic perspective. For rates on sovereign bonds, we are mostly neutral in the short term and skeptical in the long term, given looming interest-rate rises. Yields in two-year German Bunds, in particular, may not fully reflect the ECB’s intended hiking path. We are also taking a cautious stance on Italy, as the election campaign has only just started and the outcome, on September 25, remains anyone’s guess with significant scope for negative – but also positive! – surprises.
2.2 Equities
Given still tight financial conditions, recessionary fears, commodity-price volatility and geopolitical frictions, we take a similarly cautious stance on equities, with a tactically neutral positioning across all regions. In terms of sectors, we continue to favor healthcare, due to its defensive characteristics, as well as energy. European small caps in our view also remain attractive at current valuation levels.
Beyond sector, style and regional considerations, we would strongly emphasize the need for more granular, company-by-company analysis, at this point in time. Across almost all sectors, the ability to protect margins by being able to either contain expenditures or at least pass on higher input costs, is going to be more important than it has ever been in the last 15 years. But because it has been so long since the last episode of inflation at such high levels in most industrialized countries, identifying which companies within a sector can do so better than others is often a matter of judgment and of reading between the lines, when companies present and discuss their results. Each time, the key question should be not just how high earnings were in the last quarter compared to market expectations (for which the overall picture looked mildly encouraging for both the U.S. and Europe, based on the results so far; partly, that’s because expectations had already been cut by a lot). Instead, it also needs to be how sustainable earnings will prove, if input-price pressures continue to mount. Pricing power is, so to say, where the wheat will be separated from the chaff in coming weeks and months across almost all sectors.
2.3 Alternatives
For listed infrastructure and real estate, we remain tactically and strategically optimistic that these will continue to perform well in the current inflationary environment. Global uncertainties call for investment strategies centered on defensive growth: downside protection with the ability to capture inflationary upside, for example through adjustment to rents via escalation clauses or infrastructure fee income. Recession risks and sectoral, as well as regional, dynamics within particular market segments, such as office real estate need to be watched carefully, too, especially in non-listed real estate. As for commodities, we think investors will need to be quite nimble in coming months as outlined above.
3 / Past performance of major financial assets
Total return of major financial assets year-to-date and past month
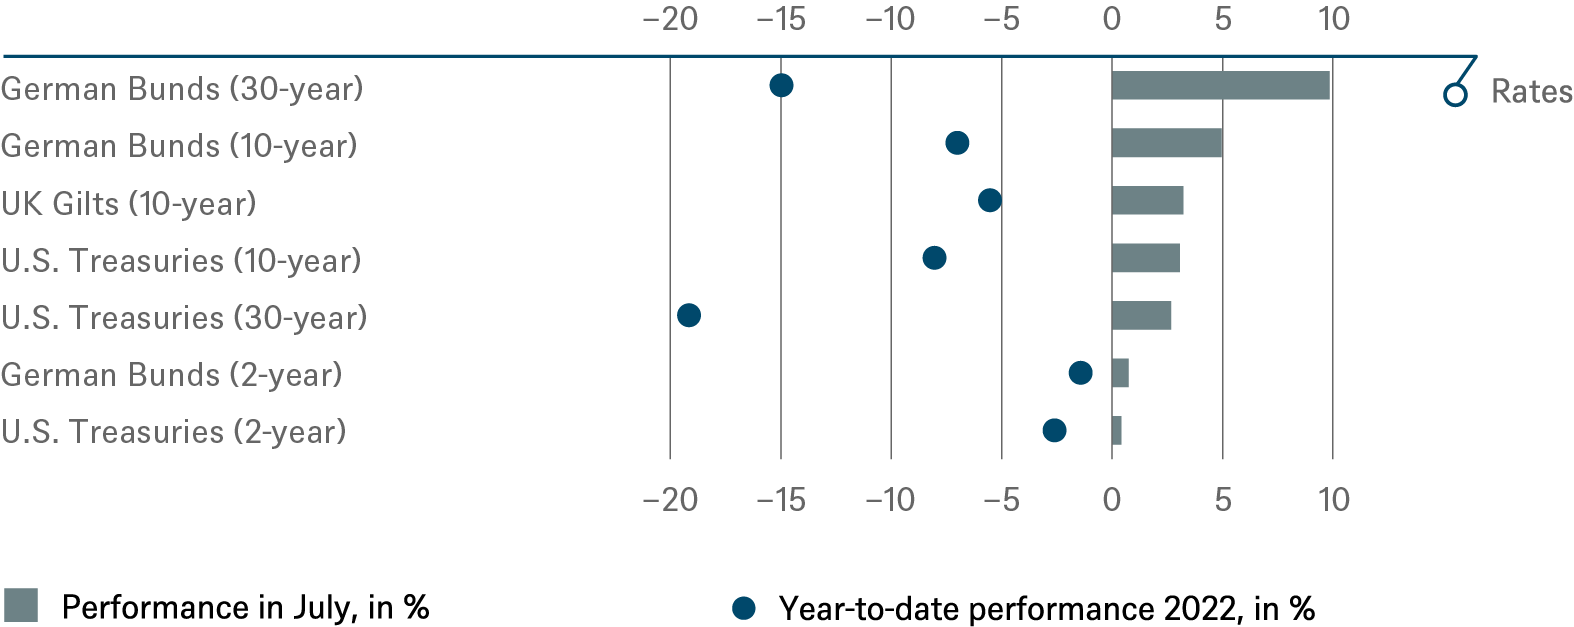
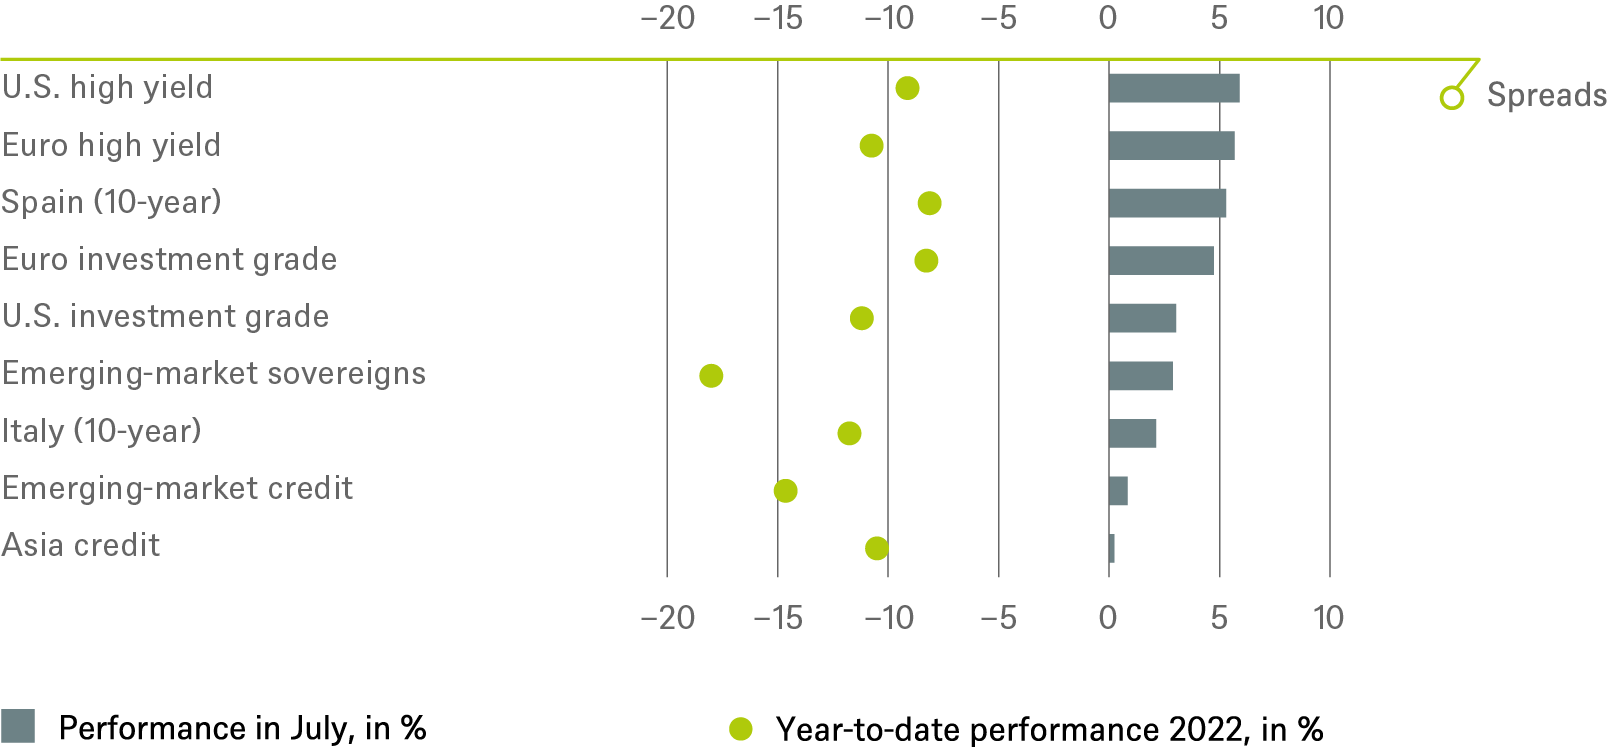
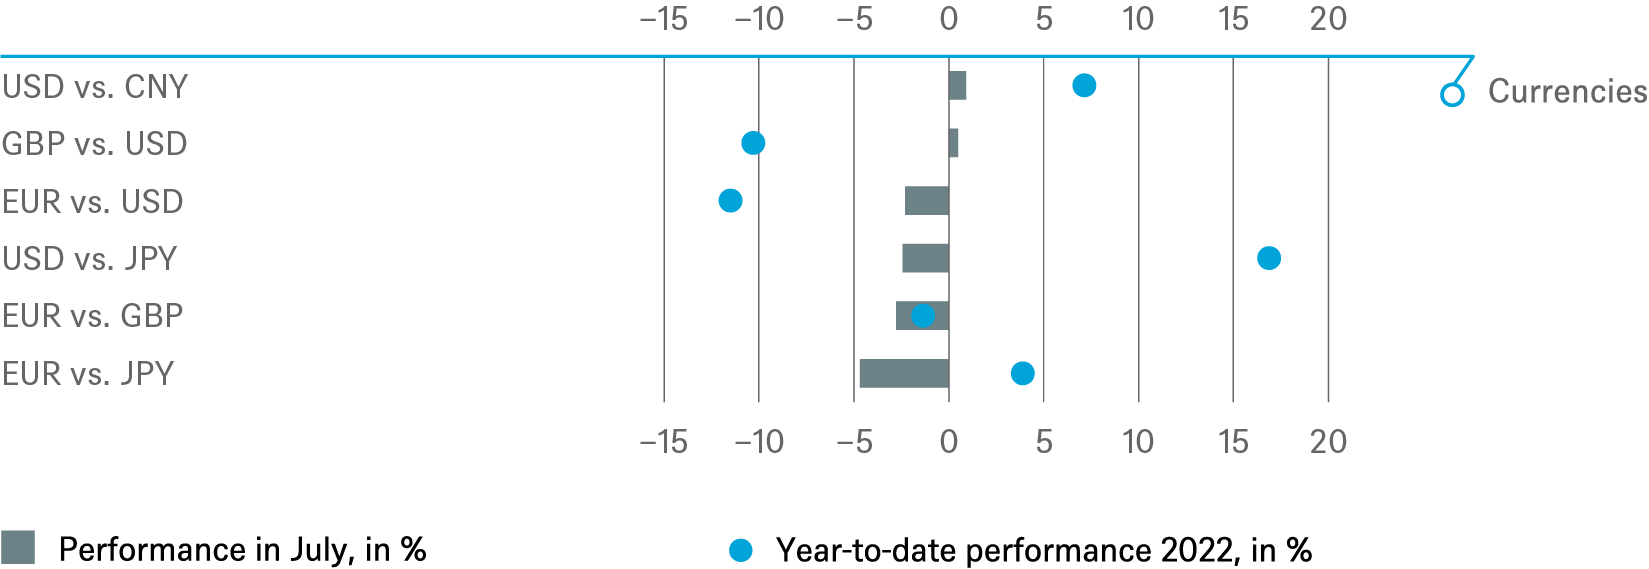
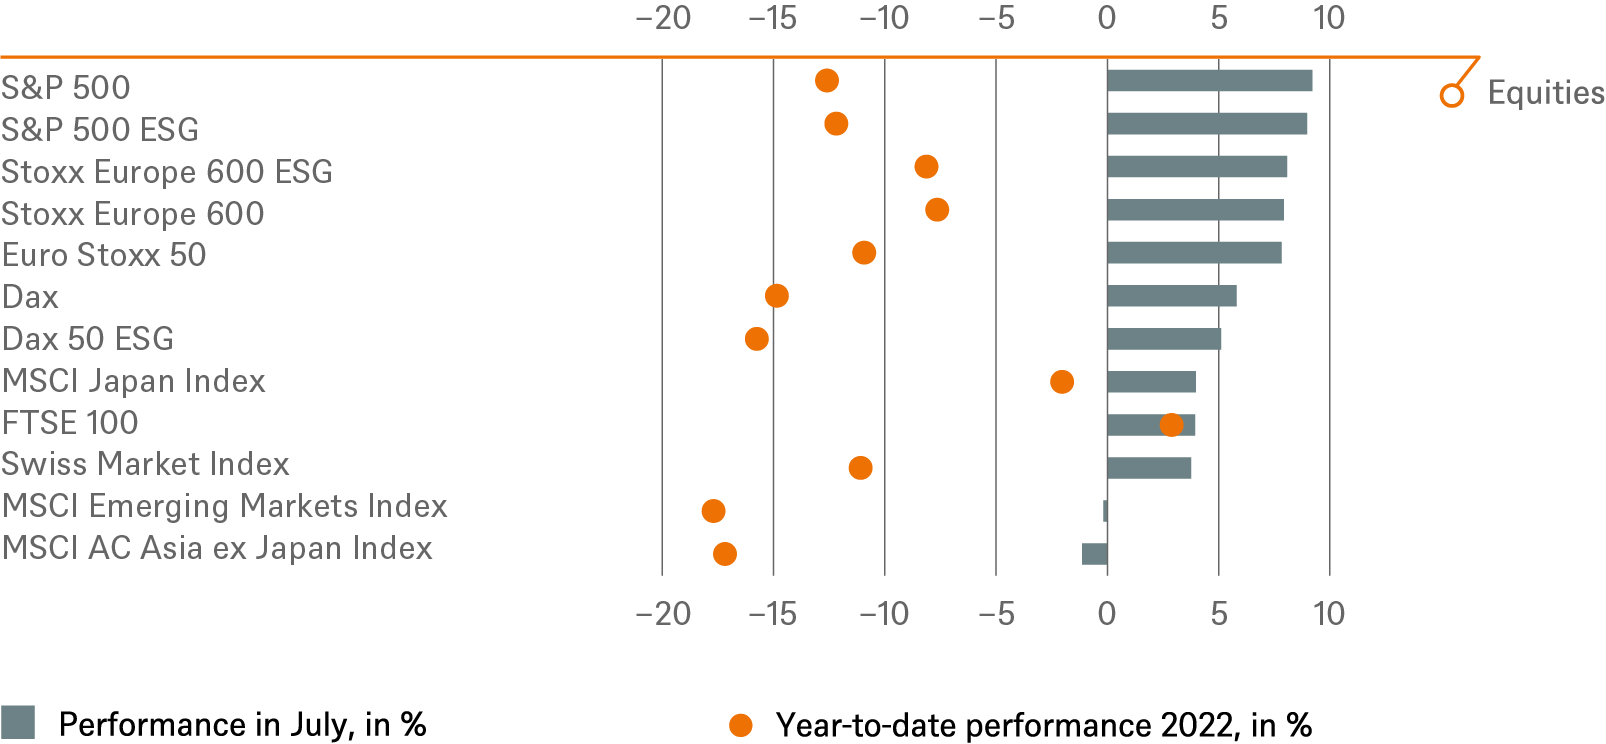
Past performance is not indicative of future returns.
Sources: Bloomberg Finance L.P. and DWS Investment GmbH as of 7/31/22
4 / Tactical and strategic signals
The following exhibit depicts our short-term and long-term positioning.
4.1 Fixed Income
Rates |
1 to 3 months |
until June 2023 |
|---|---|---|
| U.S. Treasuries (2-year) | ||
| U.S. Treasuries (10-year) | ||
| U.S. Treasuries (30-year) | ||
| German Bunds (2-year) | ||
| German Bunds (10-year) | ||
| German Bunds (30-year) | ||
| UK Gilts (10-year) | ||
| Japanese government bonds (2-year) | ||
| Japanese government bonds (10-year) |
Spreads |
1 to 3 months |
until June 2023 |
|---|---|---|
| Spain (10-year)[12] | ||
| Italy (10-year)[12] | ||
| U.S. investment grade | ||
| U.S. high yield | ||
| Euro investment grade[12] | ||
| Euro high yield[12] | ||
| Asia credit | ||
| Emerging-market credit | ||
| Emerging-market sovereigns |
Securitized / specialties |
1 to 3 months |
until June 2023 |
|---|---|---|
| Covered bonds[12] | ||
| U.S. municipal bonds | ||
| U.S. mortgage-backed securities |
Currencies |
||
|---|---|---|
| EUR vs. USD | ||
| USD vs. JPY | ||
| EUR vs. JPY | ||
| EUR vs. GBP | ||
| GBP vs. USD | ||
| USD vs. CNY |
4.2 Equity
Regions |
1 to 3 months[13] |
until June 2023 |
|---|---|---|
| United States[14] | ||
| Europe[15] | ||
| Eurozone[16] | ||
| Germany[17] | ||
| Switzerland[18] | ||
| United Kingdom (UK)[19] | ||
| Emerging markets[20] | ||
| Asia ex Japan[21] | ||
| Japan[22] |
Style |
1 to 3 months |
|
|---|---|---|
| U.S. small caps[33] | ||
| European small caps[34] |
4.4 Legend
Tactical view (1 to 3 months)
- The focus of our tactical view for fixed income is on trends in bond prices.
- Positive view
- Neutral view
- Negative view
Strategic view until June 2023
- The focus of our strategic view for sovereign bonds is on bond prices.
- For corporates, securitized/specialties and emerging-market bonds in U.S. dollars, the signals depict the option-adjusted spread over U.S. Treasuries. For bonds denominated in euros, the illustration depicts the spread in comparison with German Bunds. Both spread and sovereign-bond-yield trends influence the bond value. For investors seeking to profit only from spread trends, a hedge against changing interest rates may be a consideration.
- The colors illustrate the return opportunities for long-only investors.
- Positive return potential for long-only investors
- Limited return opportunity as well as downside risk
- Negative return potential for long-only investors


