
During the last month almost all of the price movement has been in precious metals. With safe havens continuing to be well bid by investors, gold broke through the 2,000 dollars per ounce level to a new all-time high.[1] Covid-19 concerns as well as rising coronavirus infections in the United States have kept doubts about the extent of economic recovery at the forefront of investors' minds. Meanwhile, the U.S. Federal Reserve's (Fed's) low interest-rate policy and quantitative easing should continue to support gold prices. Aside from this fear-driven demand for gold, a weaker dollar makes the metal cheaper in emerging markets (EM), increasing the ability to buy gold. Prices have recently pulled back below 2,000 dollars per ounce but a slight correction seemed inevitable as the rise in prices in the second half of July was steep. We believe, however, that the upward trend should continue as we do not expect a material change in the Fed's monetary policy and political and economic uncertainty remain. Also platinum prices should continue to be well supported as the Covid-19 pandemic has curtailed a significant amount of production in South Africa, which accounts for 75% of global supply.
As investor flows into commodities rise on hopes of economic recovery, base-metal prices have been supported by fundamentals as well. In July, a slew of commodity companies announced their earnings and highlighted the impact on supply from lower capital expenditure and workforce reductions as a result of Covid-19. Miners’ strikes in particular in Chile have added to labor-supply disruption worries. As the dollar weakness takes a pause, the momentum for metal prices may not stay as strong as we have seen in the last few weeks, but barring a deterioration in the macro sentiment, we would expect to see continued investor interest in the complex.
Energy has been the most boring part of the commodity market recently. On the supply side, the gulf states of OPEC, including adversarial Iraq and Saudi Arabia, have signed a joint statement reiterating their intention to meet the OPEC and Russia production-cap agreement. This certainly counters the concerns about production above the OPEC and Russia limits. On the demand side, gasoline demand increased strongly from June to July, consistent with the reopening of global economies. Oil, however, is a commodity that benefits from social contact and globalization – and both continue to be restricted as Covid-19 cases rise again in Europe. Therefore, we expect demand increases to be more modest in August compared with July.
Although OPEC+ and other oil-producing nations have begun to bring back supply to the market, it is being done in a gradual manner to account for a moderate recovery in global demand. Regardless of the pace of recovery, it will take a considerable amount of time to reverse oversupply and bring inventory levels down to historical averages. Therefore, we expect oil prices to remain range-bound between 40 and 45 dollars per barrel for West Texas Intermediate (WTI).
The sharp movement in natural-gas prices came after weather forecasting models showed higher than average temperatures globally, especially in Europe on expectations that air conditioning is propelling natural-gas demand. In line with these developments, export volumes for U.S. liquefied natural gas (LNG) reversed the slide to show an increase after several weeks of decline. On the policy front, the U.S. Department of Energy issued a statement allowing export of LNG to the non-free trade agreement countries into 2050, expanding both long-term supply and demand confidence. In the near term, we believe prices for natural gas are likely to hold, with weather forecasts continuing to show higher- than- average temperatures.
Meanwhile favorable weather and therefore growing conditions continue to weigh on grain prices. Even if China continues to work toward the phase one agreement purchases, we believe that surplus production and inventories will limit upside potential. High temperatures coupled with a healthy amount of rain is promising a robust crop yield. We believe the improving weather conditions are outweighing support from Chinese demand. Furthermore, with Covid-19 cases on the rise, investors are still focused on potential demand destruction from reduced economic activity rather than Chinese purchases. We expect prices for agricultural commodities to remain under pressure until Covid-19 concerns ease.
For livestock, on the other hand, the reopening of meat plants has brought significant optimism. Supply chains which had shown signs of distress have begun to return to normal. And, as restaurants reopen, demand has risen for beef and pork. We expect the improving price trend to continue.
Past 30-day and year-to-date performance of major commodity classes
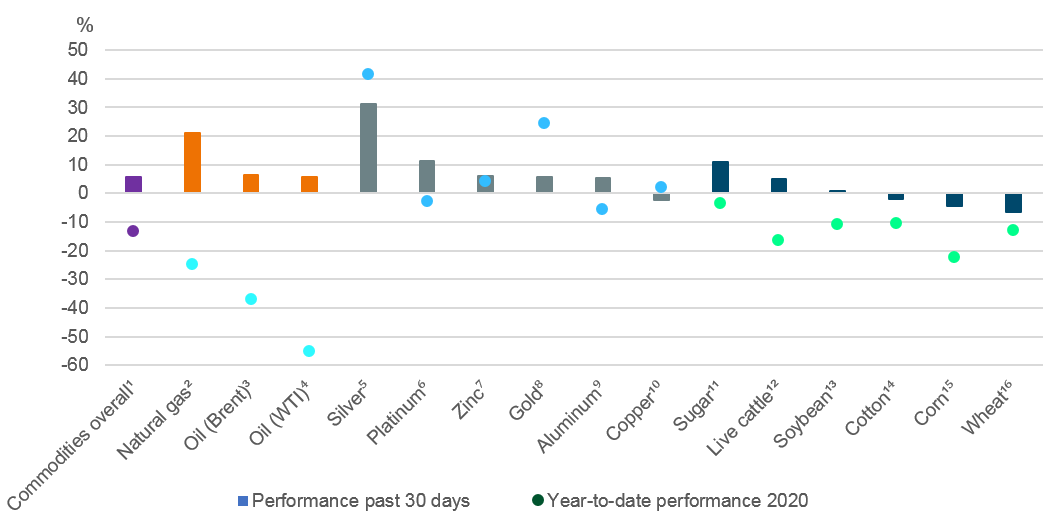
Past performance is not indicative of future returns.
Sources: Bloomberg Finance L.P., DWS Investment Management Americas Inc. as of 8/12/20
1Bloomberg Commodity Index, 2Bloomberg Natural Gas Subindex, 3Bloomberg Brent Crude Subindex, 4Bloomberg WTI Crude Oil Subindex, 5Bloomberg Silver Subindex, 6Bloomberg Platinum Subindex, 7Bloomberg Zinc Subindex, 8Bloomberg Gold Subindex, 9Bloomberg Aluminum Subindex, 10Bloomberg Copper Subindex, 11Bloomberg Sugar Subindex, 12Bloomberg Live Cattle Subindex, 13Bloomberg Soybeans Subindex, 14Bloomberg Cotton Subindex, 15Bloomberg Corn Subindex, 16Bloomberg Wheat Subindex
Appendix: Performance over the past 5 years (12-month periods)
|
|
07/15 - 07/16 |
07/16 - 07/17 |
07/17 - 07/18 |
07/18 - 07/19 |
07/19 - 07/20 |
|
Bloomberg Commodity Index |
-8.2% |
0.1% |
1.2% |
-7.5% |
-13.0% |
|
Bloomberg WTI Crude Oil Subindex |
-37.1% |
5.5% |
37.2% |
-15.8% |
-55.6% |
|
Bloomberg Brent Crude Subindex |
-32.2% |
7.5% |
47.0% |
-10.3% |
-35.2% |
|
Bloomberg Natural Gas Subindex |
-30.1% |
-24.7% |
-15.7% |
-20.9% |
-48.7% |
|
Bloomberg Gold Subindex |
22.8% |
-7.8% |
-5.5% |
13.3% |
33.6% |
|
Bloomberg Silver Subindex |
36.2% |
-19.5% |
-9.6% |
2.1% |
41.7% |
|
Bloomberg Platinum Subindex |
16.3% |
-19.4% |
-11.8% |
1.4% |
2.2% |
|
Bloomberg Copper Subindex |
-7.4% |
26.9% |
-5.2% |
-7.6% |
5.4% |
|
Bloomberg Aluminum Subindex |
-2.5% |
13.5% |
7.9% |
-16.6% |
-9.8% |
|
Bloomberg Zinc Subindex |
14.3% |
21.9% |
-4.6% |
-0.4% |
-5.1% |
|
Bloomberg Corn Subindex |
-17.0% |
-1.3% |
-12.8% |
-5.6% |
-27.8% |
|
Bloomberg Wheat Subindex |
-23.2% |
-2.9% |
-3.5% |
-18.7% |
6.1% |
|
Bloomberg Soybeans Subindex |
6.1% |
-4.2% |
-14.5% |
-12.4% |
-5.3% |
|
Bloomberg Sugar Subindex |
56.0% |
-25.0% |
-33.4% |
6.0% |
-4.7% |
|
Bloomberg Cotton Subindex |
14.5% |
-7.4% |
31.2% |
-31.4% |
-5.0% |
|
Bloomberg Live Cattle Subindex |
-17.4% |
11.5% |
-6.3% |
-0.5% |
-13.3% |
Past performance is not indicative of future returns.
Sources: Bloomberg Finance L.P., DWS Investment GmbH as of 8/12/20


