
Market overview
The DWS investment traffic lights serve to inform our readers on a monthly basis about recent market events and provide our forecasts for political and economic developments in the near future, the implications for capital markets and our investment preferences. In addition, we report four times a year – and that is the case this month – on the results of our quarterly strategy meeting in which our 12-month outlook is determined.
Both of these tasks are unusually difficult this time. Of course the future is always uncertain: an upcoming central-bank meeting, election or even surprise military action can have far-reaching consequences for capital markets. But with all these events market observers have far more experience and a better feeling for the probabilities and consequences than is now the case with the new coronavirus, COVID-19. Governments too in many cases have been ill-prepared for the virus – as the United States has shown. Here the virus has been encountering a relatively poorly prepared infrastructure, not least the White House has played down the danger to the end.[1]In addition to a noticeable economic downturn and a stock-market slump, a virus has been revealing some of the inadequacies of the U.S. healthcare system particularly for the lower wage earners and has the potential to become a major obstacle to Trump's re-election.
News of the virus's spread outside China in the last week of February has increasingly challenged our core scenario. If the pattern of infection in China evolves in line with our assumptions, we expect a similar development in other countries. Uncertainty around what will happen, even among epidemic experts, remains high though. In addition to the number of countries in which the virus has already reached triple-digit infection figures (12 as of 4 March) and the high infection rate, almost 6,000 cases in South Korea, which is important for world trade, and 2,600 cases in the heavily industrialized north of Italy, the spread of the virus to less developed countries with inadequate medical infrastructure is a particular cause for concern. There the virus could persist for longer and subsequently undergo dangerous mutations.
Markets are now adjusting to the new realities. In our view, one reason why they held up so well before the sell-off at the end of the month was that they had been hoping beforehand that monetary and fiscal stimulus packages were coming for those countries in Asia affected by the virus. In addition, the assumption that the path out of the low interest-rate environment would be an even longer one had been firmly reinforced. The fact that many equity and corporate-bond markets were still trading at record highs in mid-February partly explains why prices plunged so spectacularly at the end of February. The moves were indeed dramatic: 10-year U.S. government yields peaked at 1.68% at the beginning of February, then fell to 0.95% on March 4, far below their previous record low of 1.325% in June 2016. Two-year Treasuries needed only seven trading days to drop from a yield of 1.44% to around 0.7%. In Germany meanwhile the 10-year debt yield fell from -0.35% to as low as -0.66%. Spreads rose in emerging countries and in the European periphery, but not exceptionally. This may be in part because of the low liquidity in these markets. Risk spreads also widened in U.S. and European corporate bonds. In the investment-grade segment, there was relatively little reaction but a clear upward trend in spreads in U.S. high-yield bonds, close to levels last seen in autumn 2016. With respect to currencies, a V-formation in the euro-dollar pair stood out above all. A euro slide to 1.08 dollars per euro was immediately followed by a recovery to over 1.11. By contrast, the British pound continued to depreciate.
Markets were unsettled too by sharply declining commodity prices. A price of 45 dollars per barrel for West-Texas-Intermediate (WTI) oil caused the Bloomberg Commodity Index to fall to its lowest level since 1987. But the most emphatic of all the moves was in stock markets. In the last week of February they underwent one of the most severe corrections in their history. Never before, for example, had the S&P 500 plunged by more than 10% from its record high in so short a time. Other indices corrected by almost 15% in just six days, something which has rarely occurred before. Volatility, as measured by the Vix for the S&P 500, was over 30 for several days at the turn of the month, peaking at almost 50, a level attained on only a handful of days in the past 10 years. The stock market slide came to an interim end on the last day of February during market trading, when U.S. Federal Reserve (Fed) President Jerome Powell indicated that the central bank was prepared to react "appropriately." It took only two trading days for these words to be followed by action. Two weeks before its regular meeting, the Fed delivered an emergency Fed-Funds-rate cut of 50 basis points.
The cut raises as many questions as it answers. It is unclear, for example, whether the Fed judges the risks posed by the coronavirus to be very severe or whether it gave in to pressure from President Trump and the markets. In any event, the Fed move increases the pressure on other central banks to act, not least in order to avoid unwanted currency appreciation against the dollar. The U.S. equity markets' initial reaction to the Fed's emergency move was to fall substantially. In the medium term, however, the cut should at least prove supportive for equities. After inflation-protected bonds in the United States, 10-year TIPS, have been yielding negative returns since the end of January, most recently at -0.5%, the argument TINA (there is no alternative) could find further supporters.
For the sake of completeness, it is worth mentioning what happened in February in politics and business. Economic data showed weakness in February even though it did not yet reflect the spread of the virus, not even in timely Purchasing Managers' Indices (PMIs), except in China where they fell to historic lows: 35.7 for trade and 29.6 for services, compared to figures of 38.8 and 50.8, respectively, during the financial crisis. There is now no question that the first quarter will be very poor, and not only in China. Markets are now looking at the second quarter. In the case of China an uptrend is expected at the beginning, and for Europe and the United States at the end of the quarter.
In politics the election of the Free-Democratic-Party (FDP) politician, Thomas Kemmerich, in Thuringia with the help of the votes of the right-wing AfD, which ultimately led to the resignation of Christian-Democrat (CDU) chairwoman, Annegret Kramp-Karrenbauer, was certainly the most significant event in Germany and led to the CDU having to find a new leadership. Across Europe, the intensification of the conflict between Turkey and Syria, as well as the new wave of refugees from Turkey, was the big topic. And in the United States the field of Democratic presidential candidates is thinning. After the "Super Tuesday" of March 3, the race seems to have become a duel between Joe Biden and Bernie Sanders. That Biden's campaign has recently picked up momentum appears to be viewed positively by markets.
Outlook and changes
Although we will have to adjust some of our growth forecasts and strategic index targets in due course, many of our core scenarios from mid-February remain valid. In particular, the ongoing low interest-rate environment should continue to have a strong impact on all asset classes. We had previously anticipated a further slowdown in global economic growth and again ruled out a recession, particularly in the United States, this year and next. The slowdown in growth will now be more pronounced but we continue to believe that the virus will only temporarily affect markets and that the global economy as a whole will more or less continue on its previous growth path in the second half of the year. However, this cautiously optimistic scenario is conditional on the dip in growth and profits not leading to lasting liquidity and solvency problems. In line with the core scenario, we expect no yield increases for developed country government bonds and continuing support for corporate and emerging-market bonds. No pronounced euro strength, but also no further dollar appreciation. For equities, this environment suggests single-digit potential returns, with little to separate the different regions. We do not envisage a change in our favorite choices, i.e. away from qualitative growth stocks, in the next 12 months.
From a tactical point of view, the market events of recent weeks have led to some changes. For the time being we believe that investors will continue to be exposed to contradictory signals. On the one hand, there is the prospect of further government aid packages. On the other hand there are likely to be further negative reports on the virus and the consequences of its spread. In our view, indications that the virus is being contained are likely to be more important for a sustained recovery in the markets than fiscal and monetary aid packages.
Irrespective of this, we can now foresee further interest rate cuts by the Fed in March. For the European Central Bank (ECB) we are somewhat more cautious in this regard but expect its bond purchases to increase. Our view on bonds has shifted. After strong demand for government bonds in recent days and a corresponding fall in yields, we are now neutral on U.S. and German government bonds which we expect to trade sideways for the foreseeable future. Elsewhere we expect more movement. In view of the market weakness in recent weeks and our continued cautiously optimistic outlook, we increased the weighting of some higher-yield bonds at the beginning of March – in particular, euro-denominated corporate bonds, U.S. corporate bonds in the high-yield segment (where stock selection remains important, not least because of distortions in the energy sector), emerging-market government bonds and Italian sovereigns. Our moves may be quite early, given the expected continued volatility in the markets and the coronavirus uncertainty. But by the time the market expects an improvement in the epidemic, yield spreads are already likely to have narrowed.
From a tactical perspective, we have made the following changes in the equity segment. First, we now expect the S&P 500 to move sideways in a volatile way in the coming weeks following the correction. In the current environment, we cannot imagine that there will be a sustained rise in valuation multiples. Rather we believe, earnings forecasts for this year will be revised down noticeably. Instead of around 5% globally, we now expect earnings to stagnate. From a sector perspective, we have upgraded real estate from negative to neutral and financials from positive to neutral due to the faster than expected change in interest rates and the gloomy growth outlook. On the other hand, we have upgraded the healthcare sector to positive. In addition to its relative attractive valuation, our assessment that the headwind from U.S. policy is likely to ease for the time being also speaks in favor of this sector. We have also upgraded European small caps. Above-average earnings growth and takeover activity are among the factors that continue to be supportive for the sector. We will decide shortly as to what extent our strategic price targets need to be adjusted downwards. Based on our core scenario, however, we remain optimistic, even if the markets are likely to be rougher than expected in the coming months.
The multi-asset perspective
Even from a multi-asset perspective, the mood swings in the markets – from euphoria to panic in a few days – have been quite challenging. The question of whether to take advantage of market weaknesses in the midst of uncertainty or wait and see how the virus-infection cycle progresses will undoubtedly be answered differently, depending on investor types and strategies. In view of the extent of the market correction that has already taken place, and also in view of market behavior in China, where valuations rose again even before the significant flattening in the rate of new infections, we believe it is appropriate to maintain our risk weighting or increase it again over a longer-term investment horizon. In our view, emerging-market equities, especially from Asia, may be particularly suitable for this purpose. There, the infection cycle, which shows flattening in the rate of new cases, is several weeks ahead of the West. In addition, we believe governments in Asia are reacting even more vigorously than the West to the virus. Moreover, developments on bond markets have shifted relative valuations in favor of equities globally. As a hedge against market distortions, the Japanese yen and long-term U.S. government bonds, in particular, have again worked well. But the scope for further price appreciation seems modest, not least given that further interest-rate cuts are still being priced in.
Past performance of major financial assets
Total return of major financial assets year-to-date and past month
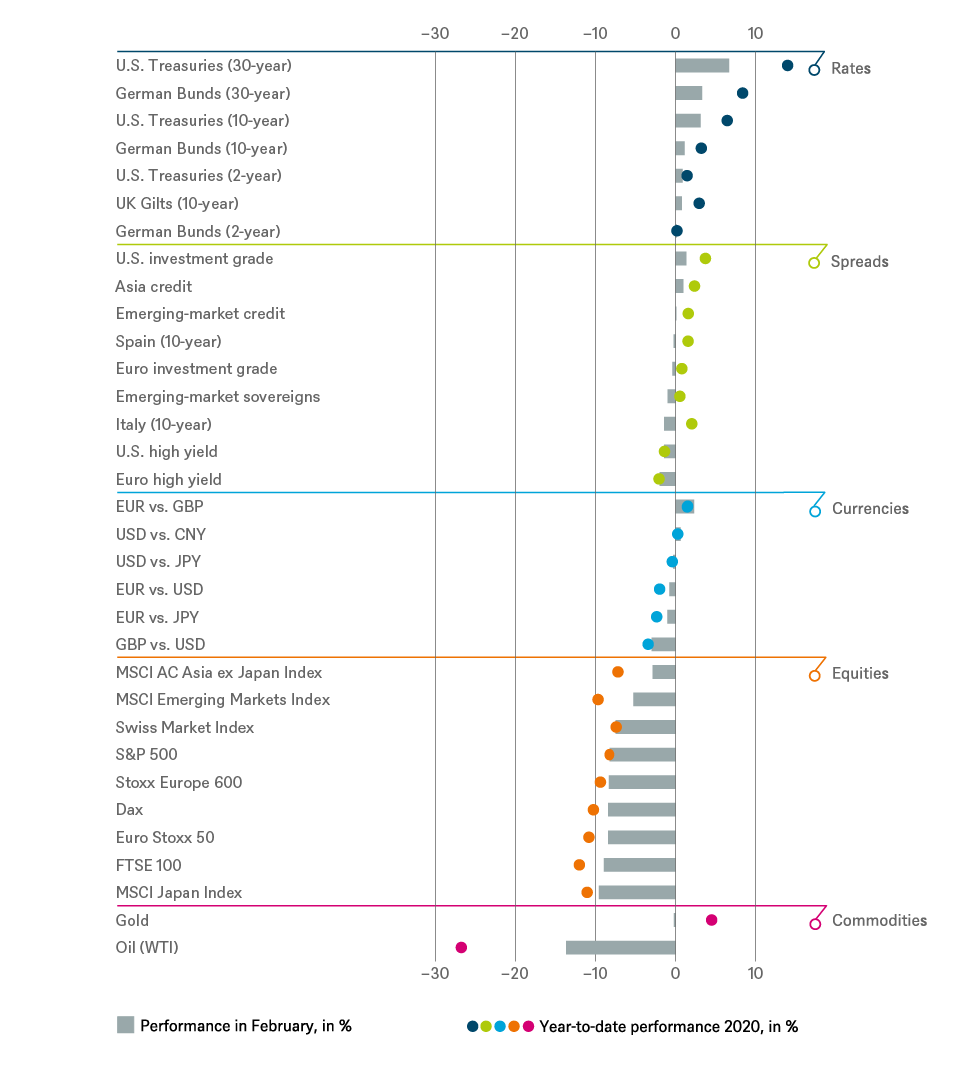
Past performance is not indicative of future returns.
Sources: Bloomberg Finance L.P., DWS Investment GmbH as of 2/28/20
Tactical and strategic signals
Fixed Income
| Rates | 1 to 3 months | until March 2021 |
|---|---|---|
| U.S. Treasuries (2-year) | ||
| U.S. Treasuries (10-year) | ||
| U.S. Treasuries (30-year) | ||
| German Bunds (2-year) | ||
| German Bunds (10-year) | ||
| German Bunds (30-year) | ||
| UK Gilts (10-year) | ||
| Japan (2-year) | ||
| Japan (10-year) |
| Spreads | 1 to 3 months | until March 2021 |
|---|---|---|
| Spain (10-year)[2] | ||
| Italy (10-year)[2] | ||
| U.S. investment grade | ||
| U.S. high yield | ||
| Euro investment grade[2] | ||
| Euro high yield[2] | ||
| Asia credit | ||
| Emerging-market credit | ||
| Emerging-market sovereigns |
| Securitized / specialties | 1 to 3 months | until March 2021 |
|---|---|---|
| Covered bonds[2] | ||
| U.S. municipal bonds | ||
| U.S. mortgage-backed securities |
| Currencies | ||
|---|---|---|
| EUR vs. USD | ||
| USD vs. JPY | ||
| EUR vs. JPY | ||
| EUR vs. GBP | ||
| GBP vs. USD | ||
| USD vs. CNY |
Equities
| Regions | 1 to 3 months[3] | until March 2021* |
|---|---|---|
| United States[4] | ||
| Europe[5] | ||
| Eurozone[6] | ||
| Germany[7] | ||
| Switzerland[8] | ||
| United Kingdom (UK)[9] | ||
| Emerging markets[10] | ||
| Asia ex Japan[11] | ||
| Japan[12] |
| Style | |
|---|---|
| U.S. small caps[24] | |
| European small caps[25] |
Legend
Tactical view (1 to 3 months)
- The focus of our tactical view for fixed income is on trends in bond prices.
- Positive view
- Neutral view
- Negative view
Strategic view until March 2021
- The focus of our strategic view for sovereign bonds is on bond prices.
- For corporates, securitized/specialties and emerging-market bonds in U.S. dollars, the signals depict the option-adjusted spread over U.S. Treasuries. For bonds denominated in euros, the illustration depicts the spread in comparison with German Bunds. Both spread and sovereign-bond-yield trends influence the bond value. For investors seeking to profit only from spread trends, a hedge against changing interest rates may be a consideration.
- The colors illustrate the return opportunities for long-only investors.
- Positive return potential for long-only investors
- Limited return opportunity as well as downside risk
- Negative return potential for long-only investors
Appendix: Performance over the past 5 years (12-month periods)
| 02/15 - 02/16 | 02/16 - 02/17 | 02/17 - 02/18 | 02/18 - 02/19 | 02/19 - 02/20 | |
|---|---|---|---|---|---|
|
Asia credit |
2.8% |
6.6% |
2.0% |
3.5% |
10.8% |
| Bloomberg Commodity Index |
-26.6% |
15.5% |
0.5% |
-7.7% |
-12.8% |
|
Covered bonds |
1.0% |
0.9% |
-0.2% |
1.3% |
3.9% |
|
Dax |
-16.7% |
24.6% |
5.1% |
-7.4% |
3.3% |
|
EM Credit |
-0.2% |
13.4% |
3.9% |
3.4% |
11.3% |
|
EM Sovereigns |
1.1% |
12.1% |
4.4% |
3.1% |
9.7% |
|
Euro high yield |
-4.5% |
14.1% |
3.9% |
0.9% |
4.0% |
| Euro investment grade |
-1.2% |
4.3% |
1.5% |
0.8% |
5.2% |
| Euro Stoxx 50 |
-15.3% |
17.3% |
6.9% |
-0.7% |
4.6% |
| FTSE 100 |
-8.8% |
24.2% |
3.4% |
2.1% |
-2.7% |
| German Bunds (10-year) |
3.4% |
0.6% |
-3.0% |
5.0% |
5.7% |
|
German Bunds (2-year) |
0.3% |
0.0% |
-1.2% |
-0.5% |
-0.3% |
|
German Bunds (30-year) |
4.2% |
-0.6% |
-4.0% |
9.4% |
16.8% |
|
Italy (10-year) |
2.2% |
-2.5% |
4.0% |
-1.9% |
14.5% |
|
Japanese government bonds (10-year) |
4.0% |
-1.0% |
0.3% |
1.2% |
1.2% |
|
Japanese government bonds (2-year) |
0.5% |
-0.2% |
-0.3% |
-0.1% |
-0.1% |
|
MSCI AC Asia ex Japan Index |
-20.4% |
26.5% |
31.9% |
-8.2% |
0.1% |
|
MSCI AC World Communication Services Index |
-9.6% |
2.2% |
-1.3% |
-2.3% |
6.3% |
|
MSCI AC World Consumer Discretionary Index |
-10.3% |
14.7% |
21.8% |
-3.0% |
3.7% |
|
MSCI AC World Consumer Staples Index |
-3.1% |
6.8% |
3.3% |
-1.4% |
1.3% |
|
MSCI AC World Energy Index |
-27.2% |
22.7% |
3.5% |
-0.6% |
-24.4% |
|
MSCI AC World Financials Index |
-20.5% |
31.6% |
18.4% |
-11.6% |
-5.2% |
|
MSCI AC World Health Care Index |
-10.8% |
9.1% |
10.7% |
6.3% |
3.8% |
|
MSCI AC World Industrials Index |
-12.2% |
21.0% |
17.5% |
-4.7% |
-2.3% |
|
MSCI AC World Information Technology Index |
-9.6% |
31.0% |
36.0% |
0.1% |
21.4% |
|
MSCI AC World Materials Index |
-26.5% |
34.9% |
18.8% |
-10.0% |
-9.7% |
|
MSCI AC World Real Estate Index |
-12.1% |
10.3% |
2.9% |
4.9% |
0.8% |
|
MSCI AC World Utilities Index |
-8.1% |
7.2% |
0.4% |
11.2% |
5.9% |
|
MSCI Emerging Market Index |
-23.4% |
29.5% |
30.5% |
-9.9% |
-1.9% |
|
MSCI Japan Index |
-9.9% |
20.3% |
21.8% |
-10.3% |
1.1% |
|
Russel 2000 Index |
-16.2% |
34.1% |
9.1% |
4.2% |
-6.3% |
|
S&P 500 |
-6.2% |
25.0% |
17.1% |
4.7% |
8.2% |
|
Spain (10-year) |
0.5% |
2.5% |
3.6% |
4.3% |
8.0% |
|
Stoxx Europe 600 |
-12.0% |
14.8% |
5.9% |
1.7% |
4.5% |
|
Stoxx Europe Small 200 |
-7.2% |
15.2% |
12.5% |
-0.8% |
4.5% |
|
Swiss Market Index |
-9.7% |
12.1% |
7.7% |
9.1% |
8.2% |
|
U.S. high yield |
-8.3% |
21.8% |
4.2% |
4.3% |
6.1% |
|
U.S. investment grade |
-1.2% |
5.7% |
2.1% |
2.7% |
15.3% |
|
U.S. MBS |
16.7% |
4.8% |
18.2% |
34.6% |
54.3% |
|
U.S. Treasuries (10-year) |
4.7% |
-2.9% |
-1.3% |
4.5% |
15.1% |
|
U.S. Treasuries (2-year) |
1.0% |
0.3% |
-0.1% |
2.3% |
4.7% |
|
U.S. Treasuries (30-year) |
4.1% |
-4.9% |
0.3% |
4.0% |
31.6% |
|
UK Gilts (10-year) |
6.0% |
3.9% |
-1.9% |
3.7% |
7.9% |
Source: Bloomberg Finance L.P., DWS Investment GmbH as of 3/2/20
Past performance is not indicative of future returns.
1. See Trump's tweets: January 24: "It will all work out well. In particular, on behalf of the American People." February 24: "The Coronavirus is very much under control in the USA. Stock market starting to look very good to me!"
3. Relative to the MSCI AC World Index
4. S&P 500
6. EuroStoxx 50
7. Dax
9. FTSE 100
10. MSCI Emerging Markets Index
11.
MSCI AC Asia ex
Japan Index
12. MSCI Japan Index
13. MSCI AC World Consumer Stables
14. MSCI AC World Health Care Index
15. MSCI AC World Communication Services Index
16. MSCI AC World Utilities Index
17. MSCI AC World Consumer Discretionary Index
18. MSCI AC World Energy Index
19. MSCI AC World Financials Index
20.
MSCI AC World
Industrials Index
21. MSCI ACWI Information Technology Index
22. MSCI AC World Materials Index
23. MSCI AC World Real Estate Index
24. Russel 2000 Index relative to the S&P 500
25.
Stoxx Europe Small 200 relative to the Stoxx
Europe 600
26.
Relative
to the Bloomberg Commodity Index


