
Market overview
The investment traffic lights review the past month and preview the next one. But at this point, at the beginning of a new decade, it is timely to consider not just December, but also the past year and decade – because there have been some quite remarkable developments in the markets. A few figures (total return in each case) speak for themselves: S&P 500 (December 2019: 3%, 2019: 31.5%, 2010 to 2020: 257%), Euro Stoxx 50 (1.2%, 29%, 86%), Dax (0.1%, 25%, 122%), MSCI Japan Index (1.3%, 19%, 127%). The MSCI Emerging Markets Index strong in the short term but weaker in the long term (7.5%, 19% and 49%). Commodities also had interesting performances: gold (4%, 19%, 39%), oil (10.7%, 15%, -23%), iron ore (5.7%, 29%, -25%) and coal (-9.6%, -39%, -37%). Within fixed income, U.S. high yield (2.1%, 14%, 106%), Italian government bonds (-0.5%, 17%, 97%), Euro high-yield bonds (1%, 10%, 88%) and Asian bonds (0.3%, 14%, 79%) performed well. Two-year German government bonds (-0.1%, -1%, 4%), however, lived up to their reputation of being unexciting. Overall, a strong decade ended with a strong year and a strong month. While commodities were a bit lumpy and short-dated[1] bonds were stagnant, investments with a good yield premium performed very well – in particular equities and corporate bonds, with the United States as the driving force. Another figure that sums up 2019 well is 17 trillion U.S. dollars. On the one hand, this was the equivalent value of all negative-yielding bonds in the summer (August 2019). On the other hand, it was the increase in the market value of all traded equities worldwide last year (more precisely, from the market low on 12/25/18 to 12/31/19).
Back to the present and the near future. December brought a little more certainty on two major global issues. First the British voted for Boris Johnson, and thus for Brexit as quickly as possible. Second, the United States and China announced that they had essentially agreed on the key points of the "phase-one" deal. The trade agreement is due to be signed on January 15. The markets reacted quite positively, judging by the marked price gains. But maybe the year-end rally also reflected markets that had the momentum to grind higher based on stabilizing economic data and larger than expected monetary stimulus. We, however, are somewhat more skeptical about both the U.S.-China treaty and Brexit. Although the extreme risks (a further escalation of punitive trade tariffs or a no-deal Brexit) may have diminished, many risks remain. The concrete U.S.-China treaty may turn out to be much less solid than hoped for, and Boris Johnson's Brexit timeline may prove hopelessly overambitious.
Meanwhile the new European-Central-Bank (ECB) President Christine Lagarde hosted her first press conference in December. She made it clear that for the time being there would be no changes to monetary policy, but that in the medium term the goals, instruments and strategies of the bank would be tested and its mandate might be interpreted more broadly – including for example environmental and social targets as well. On the macroeconomic side, the Purchasing Managers' Indices (PMIs) stabilized in many regions in December, although manufacturing mostly remained in recessionary territory. However, the most recent Ifo figures from Germany clearly exceeded expectations. The U.S. labor market meanwhile continues to look strong.
Summing up, the year ended somewhat better than expected on a political level, and a recession did not occur in any of the world's major economies. Growth, however, was not higher than most observers had expected and corporate earnings actually fell short of expectations. On the other hand, the central banks were far more expansionary than expected at the beginning of the year – and the markets performed much better than expected. At 27.3%, the MSCI AC World Index achieved its third best annual total return since 1991. This is not necessarily a bad omen for the current year, as historically a good year has been followed by another good year more often than not. But stretched valuations and the generally quite high level of market confidence leave us only cautiously optimistic.
Outlook and changes
Before we move on to the tactical (one-to-three month horizon) changes, a brief word about our strategic outlook (12-months horizon). Shortly before Christmas, a brief strategy meeting was held to review the decisions made at the last meeting in light of market developments and the progress made on Brexit and the U.S.-China trade dispute. Overall, our 12-month forecasts showed little need for revision. The price target for the S&P 500 was adjusted slightly upward on the basis of lower tariff forecasts. The pronounced year-end rally pushed market indices to levels that leave little more return potential (according to our index forecasts) than the expected dividend yield.
On a tactical level, we have made no changes at a sector or country level for equities. Even though we expect positive returns over a 12-month period, we do see potential for disappointment in the short term, whether in an unpromising partial agreement between the United States and China, or in Boris Johnson's risky, high-speed game with the EU. Disappointments could also come from the reporting season for the fourth quarter, as the uncertainty caused by the trade dispute could still be reflected in many sectors. The U.S. election campaign could also cause volatile markets, especially as the president is facing impeachment proceedings. Although we do not expect them to affect his current term of office.
There have been some tactical adjustments in bonds and currencies. These primarily reflect the perceived easing in the trade dispute, which has increased investors' appetite for risk. For this reason, we have upgraded emerging-market corporate bonds and U.S. investment grade to positive, as well as U.S. mortgage-backed securities. We have also downgraded the euro-yen currency pair to neutral. Although we continue to regard the yen as a good hedge against macro risks, we do not see any further appreciation against the euro in the short term. Most recently, due to macroeconomic stabilization and recently slower supply growth, we have upgraded crude oil and, as a potential hedging instrument, gold.
The multi-asset perspective
From a portfolio perspective we are entering the New Year with a somewhat more cautious attitude after the year-end rally. This means a lower equity allocation and a slightly higher weighting for long-term bonds compared with the previous month in order to be ready for short-term market corrections. In regional terms, we are focusing more on equities in the United States and the Eurozone and are maintaining a balanced weighting of growth vs. value stocks. For bonds we expect largely sideway movements, but see a slightly better risk-return profile in the United States.
Past performance of major financial assets
Total return of major financial assets year-to-date and past month
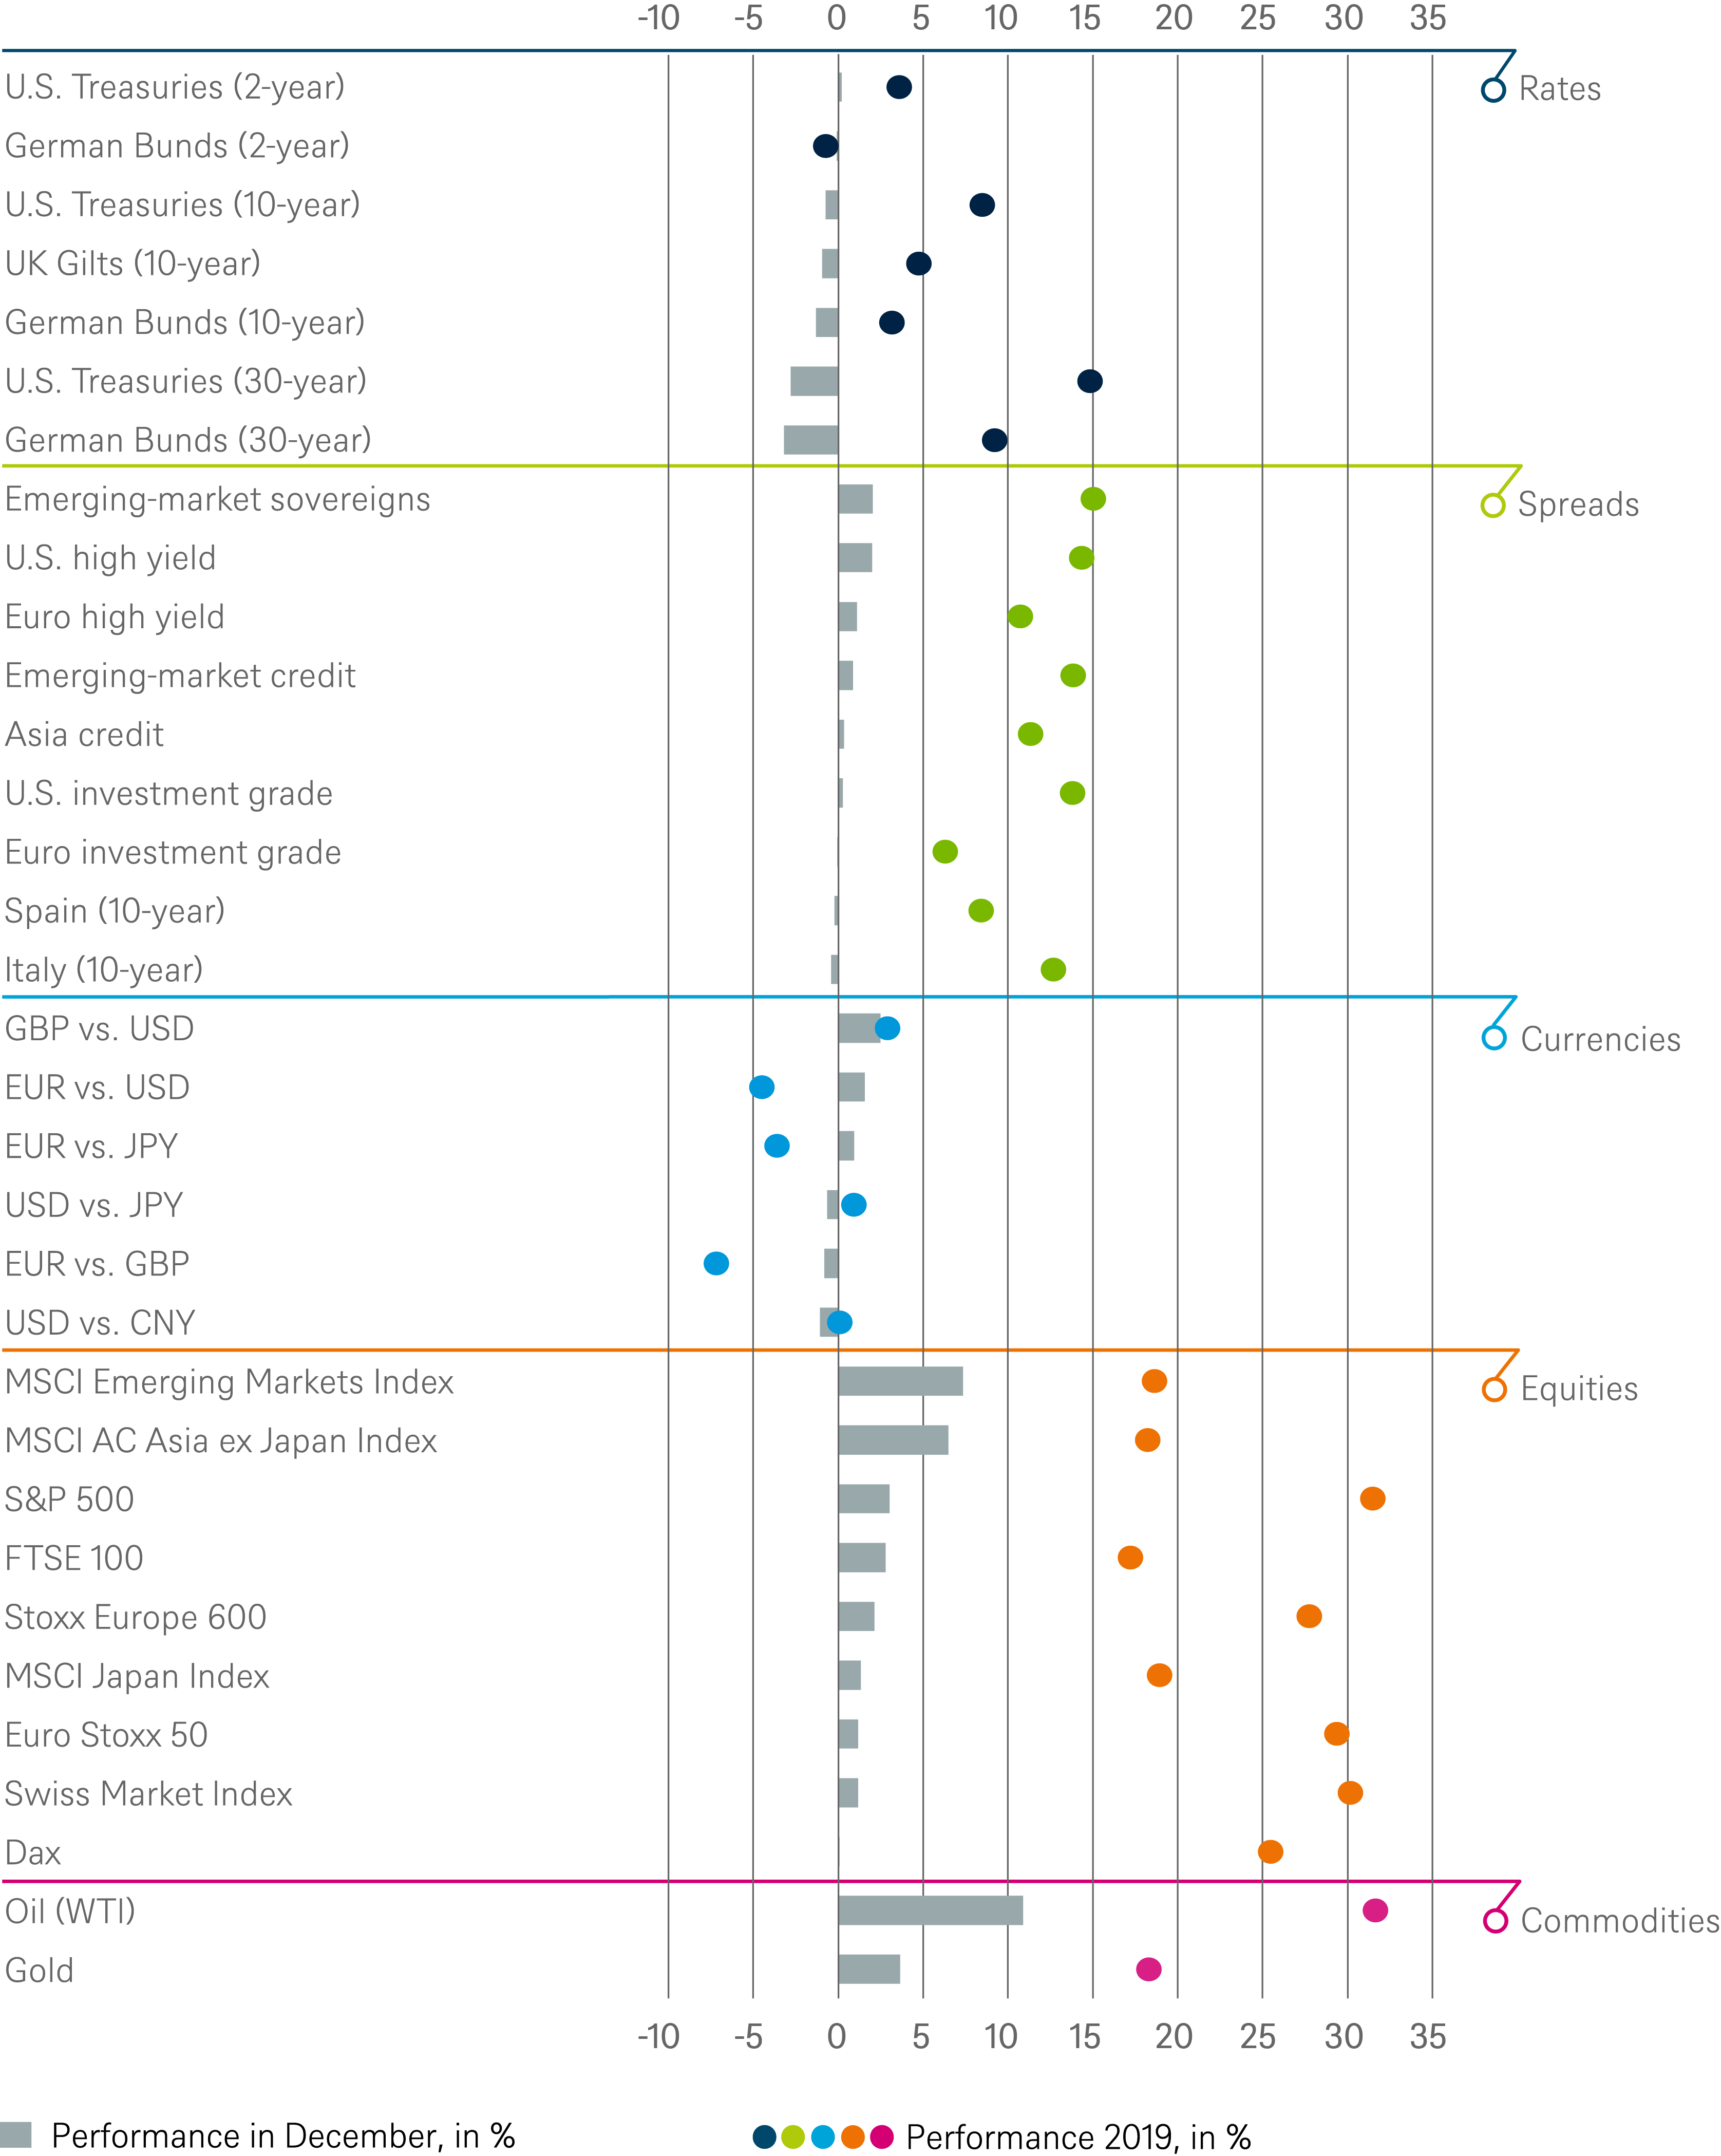
Sources: Bloomberg Finance L.P., DWS Investment GmbH as of 12/31/19
Tactical and strategic signals
Fixed Income
| Rates | 1 to 3 months | until December 2020 |
|---|---|---|
| U.S. Treasuries (2-year) | ||
| U.S. Treasuries (10-year) | ||
| U.S. Treasuries (30-year) | ||
| German Bunds (2-year) | ||
| German Bunds (10-year) | ||
| German Bunds (30-year) | ||
| UK Gilts (10-year) | ||
| Japan (2-year) | ||
| Japan (10-year) |
| Spreads | 1 to 3 months | until December 2020 |
|---|---|---|
| Spain (10-year)[2] | ||
| Italy (10-year)[2] | ||
| U.S. investment grade | ||
| U.S. high yield | ||
| Euro investment grade[2] | ||
| Euro high yield[2] | ||
| Asia credit | ||
| Emerging-market credit | ||
| Emerging-market sovereigns |
| Securitized / specialties | 1 to 3 months | until December 2020 |
|---|---|---|
| Covered bonds[2] | ||
| U.S. municipal bonds | ||
| U.S. mortgage-backed securities |
| Currencies | ||
|---|---|---|
| EUR vs. USD | ||
| USD vs. JPY | ||
| EUR vs. JPY | ||
| EUR vs. GBP | ||
| GBP vs. USD | ||
| USD vs. CNY |
Equities
| Regions | 1 to 3 months[3] | until December 2020 |
|---|---|---|
| United States[4] | ||
| Europe[5] | ||
| Eurozone[6] | ||
| Germany[7] | ||
| Switzerland[8] | ||
| United Kingdom (UK)[9] | ||
| Emerging markets[10] | ||
| Asia ex Japan[11] | ||
| Japan[12] |
| Style | |
|---|---|
| U.S. small caps[24] | |
| European small caps[25] |
Legend
Tactical view (1 to 3 months)
- The focus of our tactical view for fixed income is on trends in bond prices.
- Positive view
- Neutral view
- Negative view
Strategic view until December 2020
- The focus of our strategic view for sovereign bonds is on bond prices.
- For corporates, securitized/specialties and emerging-market bonds in U.S. dollars, the signals depict the option-adjusted spread over U.S. Treasuries. For bonds denominated in euros, the illustration depicts the spread in comparison with German Bunds. Both spread and sovereign-bond-yield trends influence the bond value. For investors seeking to profit only from spread trends, a hedge against changing interest rates may be a consideration.
- The colors illustrate the return opportunities for long-only investors.
- Positive return potential for long-only investors
- Limited return opportunity as well as downside risk
- Negative return potential for long-only investors
Appendix: Performance over the past 5 years (12-month periods)
| 12/14 - 12/15 | 12/15 - 12/16 | 12/16 - 12/17 | 12/17 - 12/18 | 12/18 - 12/19 | |
|---|---|---|---|---|---|
|
S&P 500 |
1.4% |
12.0% |
21.8% |
-4.4% |
31.5% |
|
Stoxx Europe 600 |
10.1% |
2.4% |
11.2% |
-10.3% |
27.7% |
|
Euro Stoxx 50 |
7.3% |
4.8% |
9.9% |
-11.3% |
29.4% |
|
Dax |
9.6% |
6.9% |
12.5% |
-18.3% |
25.5% |
|
Swiss Market Index |
1.2% |
-3.4% |
17.9% |
-7.0% |
30.2% |
|
FTSE 100 |
-1.3% |
19.2% |
12.0% |
-8.8% |
17.2% |
|
MSCI Emerging Market Index |
-14.9% |
11.2% |
37.3% |
-14.6% |
18.4% |
|
MSCI AC Asia ex Japan Index |
-9.2% |
5.4% |
41.7% |
-14.4% |
18.2% |
|
MSCI Japan Index |
9.6% |
2.4% |
24.0% |
-12.9% |
19.6% |
|
MSCI AC World Consumer Staples Index |
2.9% |
-0.5% |
15.3% |
-12.5% |
19.1% |
|
MSCI AC World Health Care Index |
4.9% |
-8.3% |
18.4% |
0.2% |
20.9% |
|
MSCI AC World Communication Services Index |
-5.2% |
1.8% |
4.0% |
-14.1% |
22.8% |
|
MSCI AC World Utilities Index |
-10.8% |
2.6% |
10.9% |
-1.5% |
17.9% |
|
MSCI AC World Consumer Discretionary Index |
2.7% |
1.2% |
23.4% |
-9.6% |
25.9% |
|
MSCI AC World Energy Index |
-24.5% |
23.9% |
3.8% |
-15.8% |
8.8% |
|
MSCI AC World Financials Index |
-7.8% |
9.3% |
21.1% |
-17.9% |
19.7% |
|
MSCI AC World Industrials Index |
-4.8% |
9.8% |
23.2% |
-15.8% |
24.3% |
|
MSCI AC World Information Technology Index |
1.9% |
10.8% |
40.3% |
-6.8% |
45.1% |
|
MSCI AC World Materials Index |
-18.1% |
21.2% |
27.0% |
-18.1% |
16.4% |
|
MSCI AC World Real Estate Index |
-3.1% |
-0.5% |
14.5% |
-10.4% |
19.7% |
|
Russel 2000 Index |
-5.7% |
19.5% |
13.1% |
-12.2% |
23.7% |
|
Stoxx Europe Small 200 |
16.4% |
1.1% |
18.6% |
-12.4% |
30.0% |
|
U.S. Treasuries (2-year) |
0.6% |
0.9% |
0.4% |
1.6% |
3.6% |
|
U.S. Treasuries (10-year) |
1.7% |
0.8% |
2.6% |
0.9% |
8.5% |
|
U.S. Treasuries (30-year) |
-1.0% |
1.1% |
8.6% |
-1.8% |
14.8% |
|
UK Gilts (10-year) |
0.7% |
7.8% |
1.8% |
1.5% |
4.8% |
|
Italy (10-year) |
4.9% |
1.0% |
1.6% |
-1.9% |
12.7% |
|
Spain (10-year) |
1.3% |
5.2% |
2.1% |
2.8% |
8.4% |
|
German Bunds (2-year) |
0.3% |
0.2% |
-0.9% |
-0.4% |
-0.7% |
|
German Bunds (10-year) |
0.8% |
4.3% |
-0.8% |
2.7% |
3.2% |
|
German Bunds (30-year) |
0.4% |
9.5% |
-2.6% |
6.3% |
9.2% |
|
Japanese government bonds (2-year) |
0.0% |
0.1% |
-0.2% |
-0.1% |
-0.3% |
|
Japanese government bonds (10-year) |
1.3% |
1.6% |
0.3% |
0.9% |
0.2% |
|
U.S. investment grade |
-0.8% |
5.6% |
6.2% |
-2.1% |
13.8% |
|
U.S. high yield |
-4.5% |
17.1% |
7.5% |
-2.1% |
14.3% |
|
Euro investment grade |
-0.7% |
4.7% |
2.4% |
-1.3% |
6.3% |
|
Euro high yield |
0.5% |
10.1% |
6.1% |
-3.6% |
10.7% |
|
Asia credit |
2.8% |
5.8% |
5.8% |
-0.8% |
11.3% |
|
EM Credit |
1.0% |
11.1% |
7.9% |
-1.5% |
13.8% |
|
EM Sovereigns |
1.2% |
10.2% |
10.3% |
-4.3% |
15.0% |
|
Covered bonds |
0.4% |
2.2% |
0.7% |
0.3% |
2.8% |
|
U.S. MBS |
-11.1% |
-37.5% |
66.7% |
40.0% |
11.4% |
Source: Bloomberg Finance L.P., DWS Investment GmbH as of 1/2/20
Past performance is not indicative of future returns.
1. Short-term refers in this article to a time horizon of one-to-three months and long-term to a time horizon of nine-to-fourteen months.
3. Relative to the MSCI AC World Index
4. S&P 500
6. EuroStoxx 50
7. Dax
9. FTSE 100
10. MSCI Emerging Markets Index
11.
MSCI AC Asia ex
Japan Index
12. MSCI Japan Index
13. MSCI AC World Consumer Stables
14. MSCI AC World Health Care Index
15. MSCI AC World Communication Services Index
16. MSCI AC World Utilities Index
17. MSCI AC World Consumer Discretionary Index
18. MSCI AC World Energy Index
19. MSCI AC World Financials Index
20.
MSCI AC World
Industrials Index
21. MSCI ACWI Information Technology Index
22. MSCI AC World Materials Index
23. MSCI AC World Real Estate Index
24. Russel 2000 Index relative to the S&P 500
25.
Stoxx Europe Small 200 relative to the Stoxx
Europe 600
26.
Relative
to the Bloomberg Commodity Index


