- Home »
- Insights »
- DWS Research Institute »
- DWS Long View - 2022

- Return forecasts in almost most asset classes are well below the returns achieved over the past decade, with inflationary pressures posing further risks to real returns
- Delayed or insufficient challenges climate transition policy presents risks to real and nominal returns
- The Russo-Ukrainian war has the potential to exacerbate secular trends that pose inflationary risks
to read
Click here to download the full paper.
Executive Summary
Two years into the COVID-19 crisis, the residual effects of lockdowns are being felt across different segments of the global economy. Price pressures remain stickier than previously expected as supply chain and labor shortage issues are exacerbated by the sharp rebound in consumer demand. Labor markets have tightened considerably, and while labor participation remains below pre-COVID levels, wages have accelerated noticeably in recent quarters. Central bankers have appropriately shifted toward more hawkish monetary guidance, at a pace markedly faster than markets anticipated. Most importantly, the timeliness of addressing climate change, and the implications of not doing so, has shifted into view for policymakers and investors.
At the outset of the year, asset prices remain elevated relative to history, reflecting strong economic and corporate fundamentals within an environment of continued easy global monetary policy. As central bankers shift toward modest quantitative tightening, the pace of normalization across asset valuations remains a key question for investors. Over a strategic time horizon, global growth prospects remain challenged, particularly across developed economies, due to intensifying demographic shifts as baby boomers continue to retire and working-age populations continue to shrink. Valuations across asset classes remain rich as well, as equity multiples continue to be elevated above historical averages and corporate and sovereign credit spreads trade historically tight. While sovereign bond yields have moved modestly higher, interest rates in real terms—adjusted for market-priced inflation, continue to be in negative territory across most developed markets. These higher levels on inflation pricing across even longer-term structures have historically implied steeper term premiums across sovereign yield curves. Quantitative tightening presents additional upside risks to interest rates. Taking these factors into consideration, we present our long-term ten-year return forecasts across asset classes which we refer to as our “Long View”.
In our Long View, we show our forecasted returns across asset classes and regions on the efficient frontier, which represents the trade-off investors must make between risk and returns. Figure 11 depicts the efficient frontier over the last ten years since the credit crisis and compares it to the efficient frontier over the past two decades. As seen, the post-financial crisis efficient frontier is steeper. What this suggests is on a relative basis, investors received greater compensation for commensurate levels of risk in the decade following the financial crisis.
Efficient frontiers: 10 year forecast and historical returns and volatilities, annualised

In an environment of more conservative asset-class return expectations, strategic asset allocation becomes increasingly important, utilizing a rigorous and disciplined approach to portfolio construction. The prevalence of ESG investing over the past year alone has been quite dramatic across almost all segments of asset markets and will continue to be a building block for investor portfolios. Thus, we incorporate a number of important regional ESG indices into our return forecasts.
This publication details the long-term capital market views that underpin the strategic allocations for DWS’s multi-asset portfolios. These estimates are based on 10-year models and should not be compared with the 12-month forecasts published in the DWS CIO View.
Central to this document is our belief that clients should[1] consider a long-term perspective beyond 1-5 years when it comes to constructing investment portfolios. Perhaps, counterintuitively, extending the investment horizon has, in the past, produced less volatile, more precise forecasts, as shown in Figure 13: while risk still matters and there is still a distribution of investment outcomes around any central forecast, this distribution has tended to become narrower when investing for longer investment horizons. One consequence of this is that entry points become less relevant (even though of course by no means irrelevant) for longer investment horizons (because cyclical and tactical drivers are overtaken by fundamental, structural drivers of asset class returns).For example, we believe that many asset-class valuations are high today relative to history. But taking one of the biggest previous bubbles (the dot.com boom) as an example, the difference between buying exactly at the peak of the dot.com boom in April 2000 vs. a year later only amounts to one percent compounded annually when investing with a 15-year time horizon (as we show on page 20). However, if an investor had had a shorter horizon of five years, the difference in returns generated from buying at the peak versus one year later was greater, amounting to roughly six percent per annum. Thus, while asset prices may be high today relative to history, over long-run periods (15 years in this example), returns seem to be driven by their underlying fundamental building blocks.
Looking at rolling one-year price returns of the S&P 500 from 1871 to 2019, a negative two-standard-deviation move equated to a 27 percent decline in prices. When calculating a negative two-standard-deviation move using rolling 10-year returns over this same time frame, the decline in prices is less than 1 percent per annum. More stable long-run returns can be helpful in establishing more stable strategic-asset-allocation targets. Hence, sceptics may be surprised to learn that the volatility of returns historically has been lower when using long-term horizons, although past performance may not be indicative of future results.
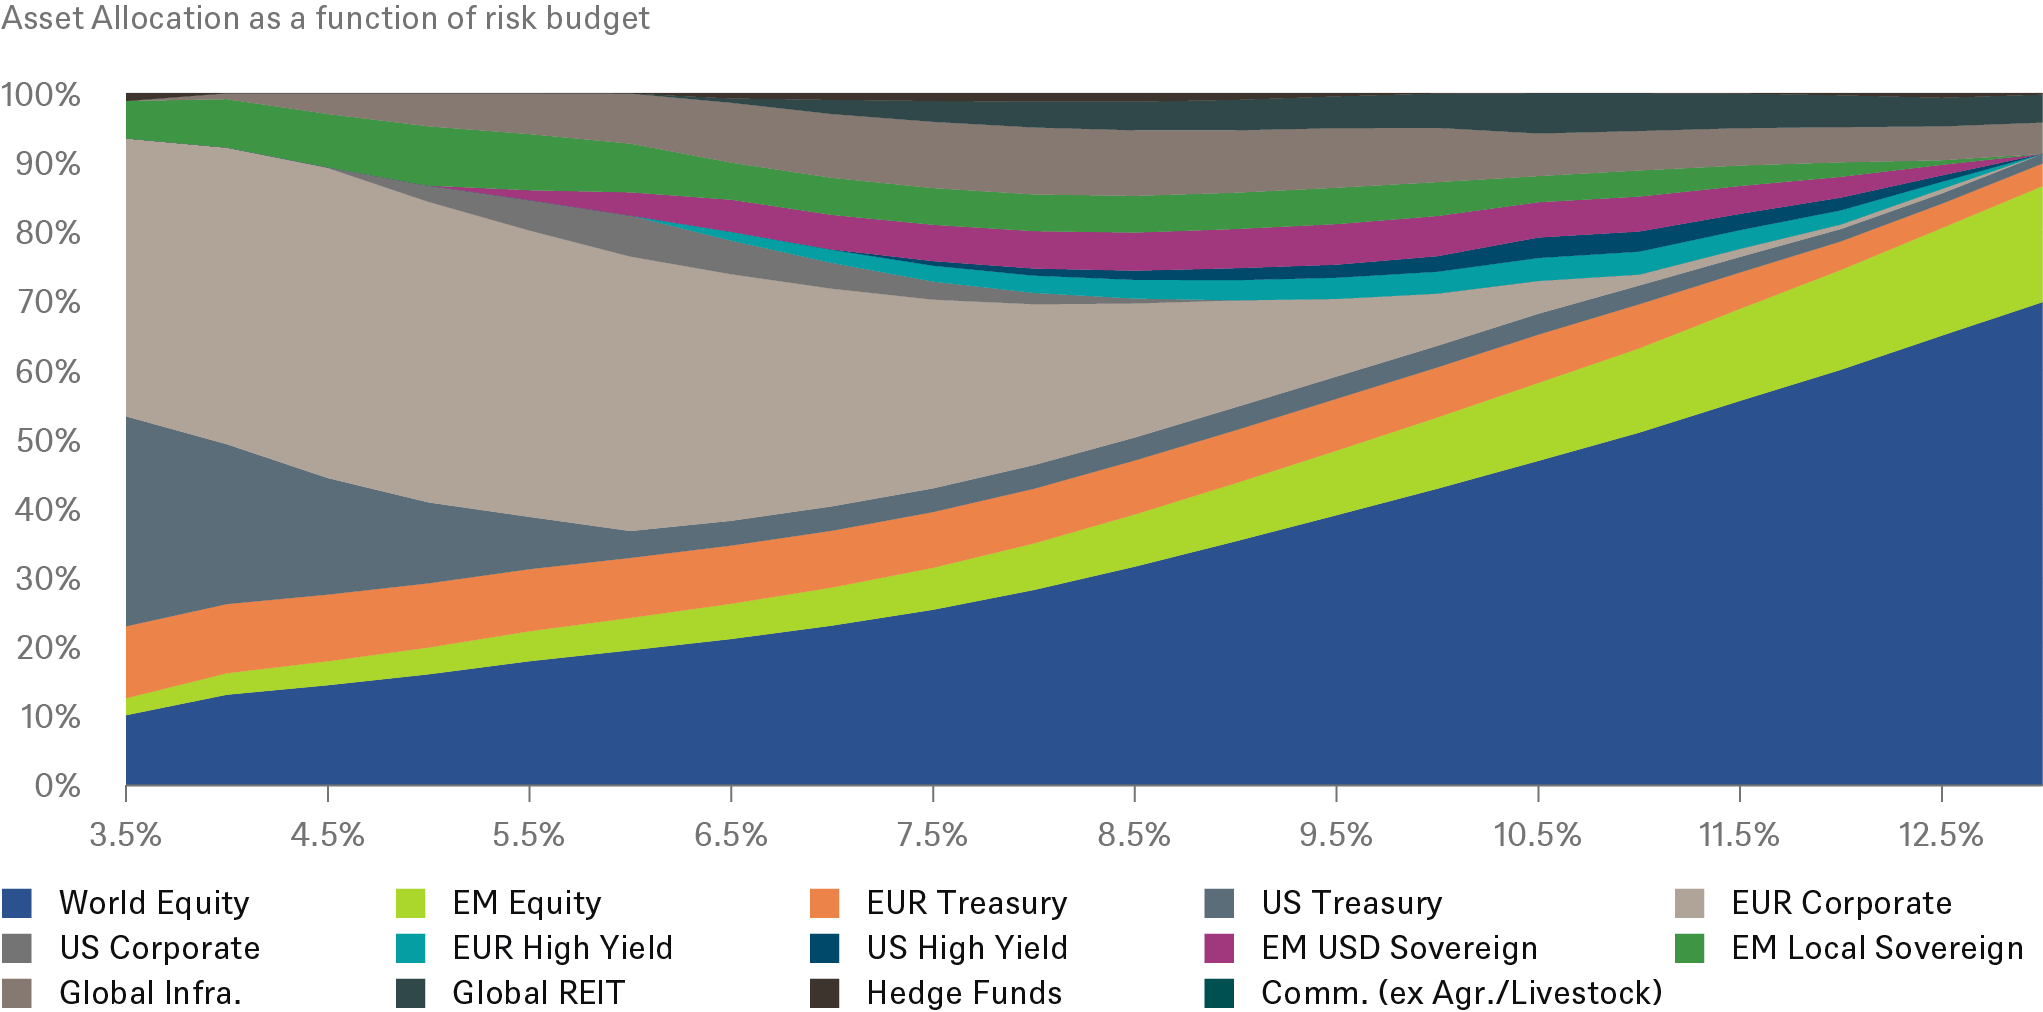
Asset allocation and risk allocation by target volatility
 |
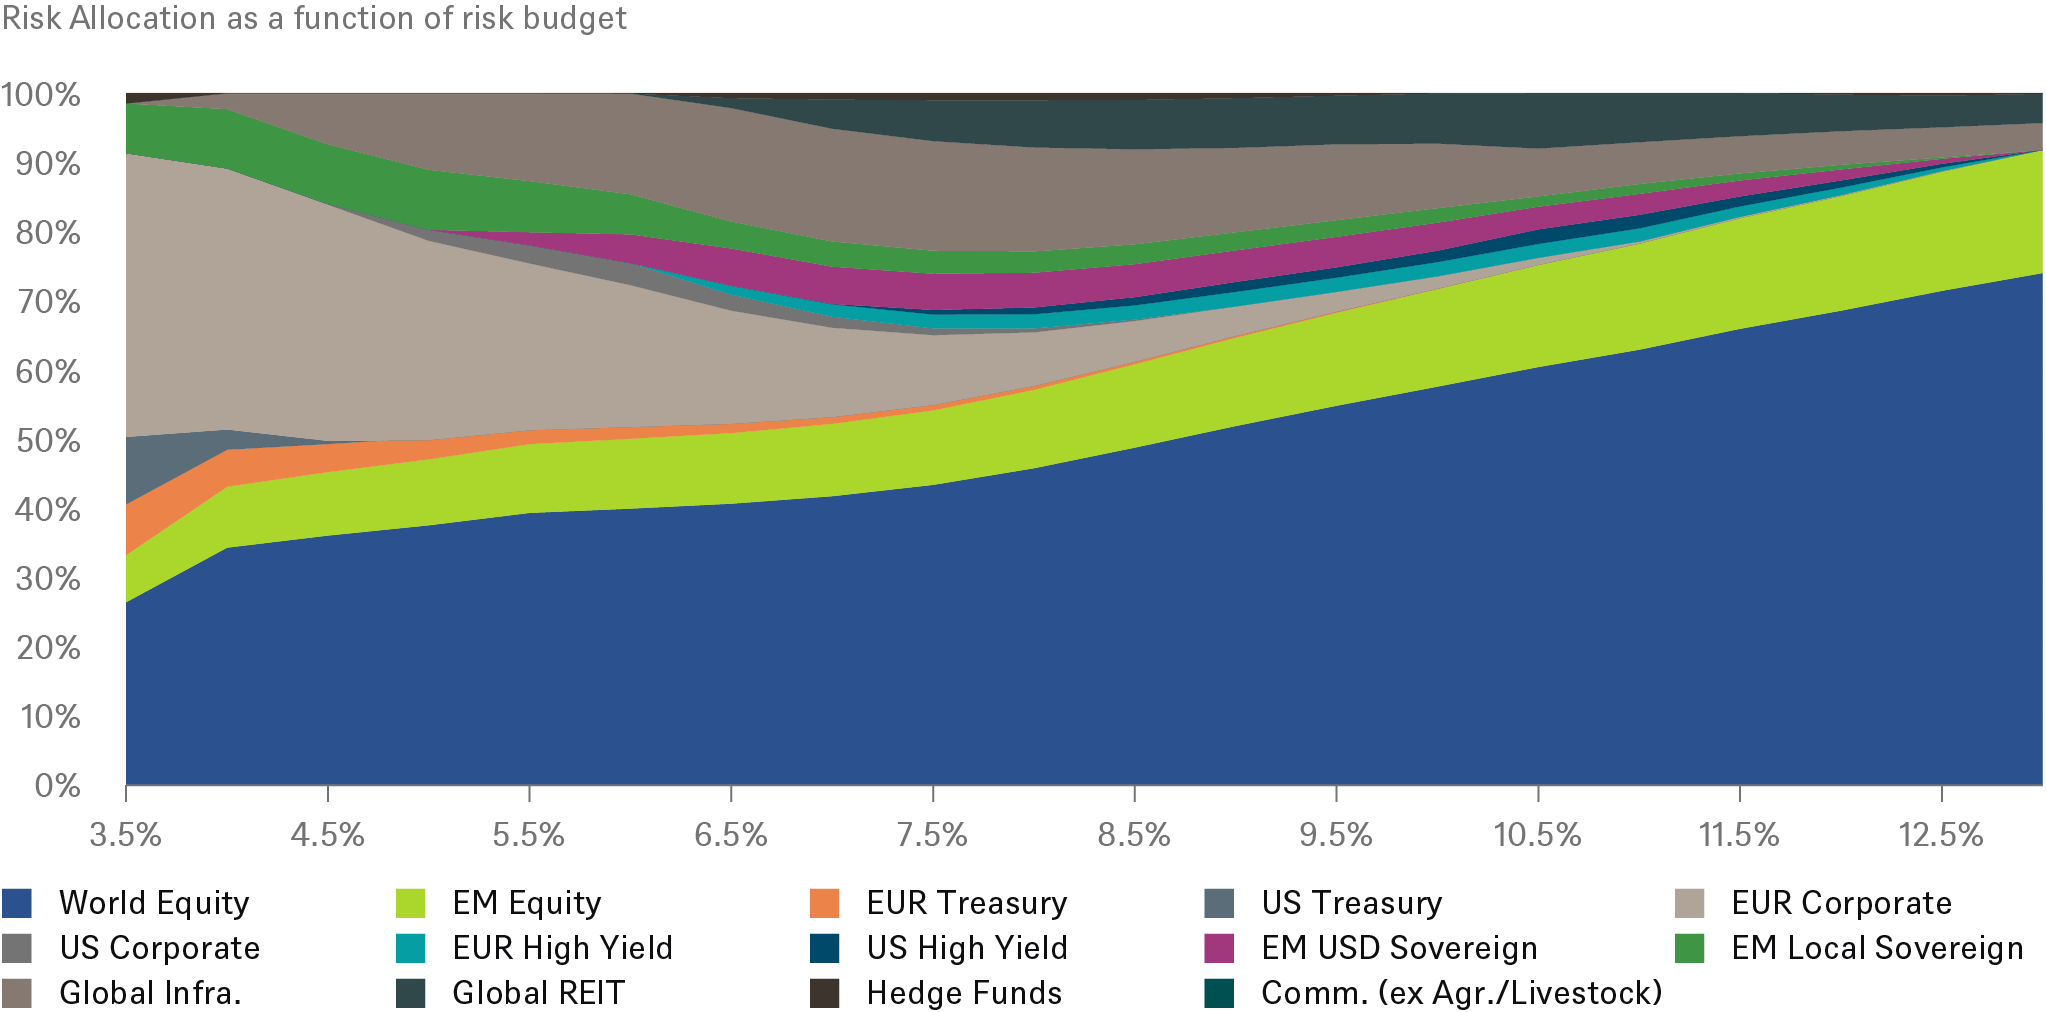 |
Source: DWS Investments UK Limited. Data as of 12/31/21. For illustrative purposes only. See page 29 for details. See appendix for the representative index corresponding to each asset class.
Distribution of U.S. equities: Historical returns over different time periods, annualised
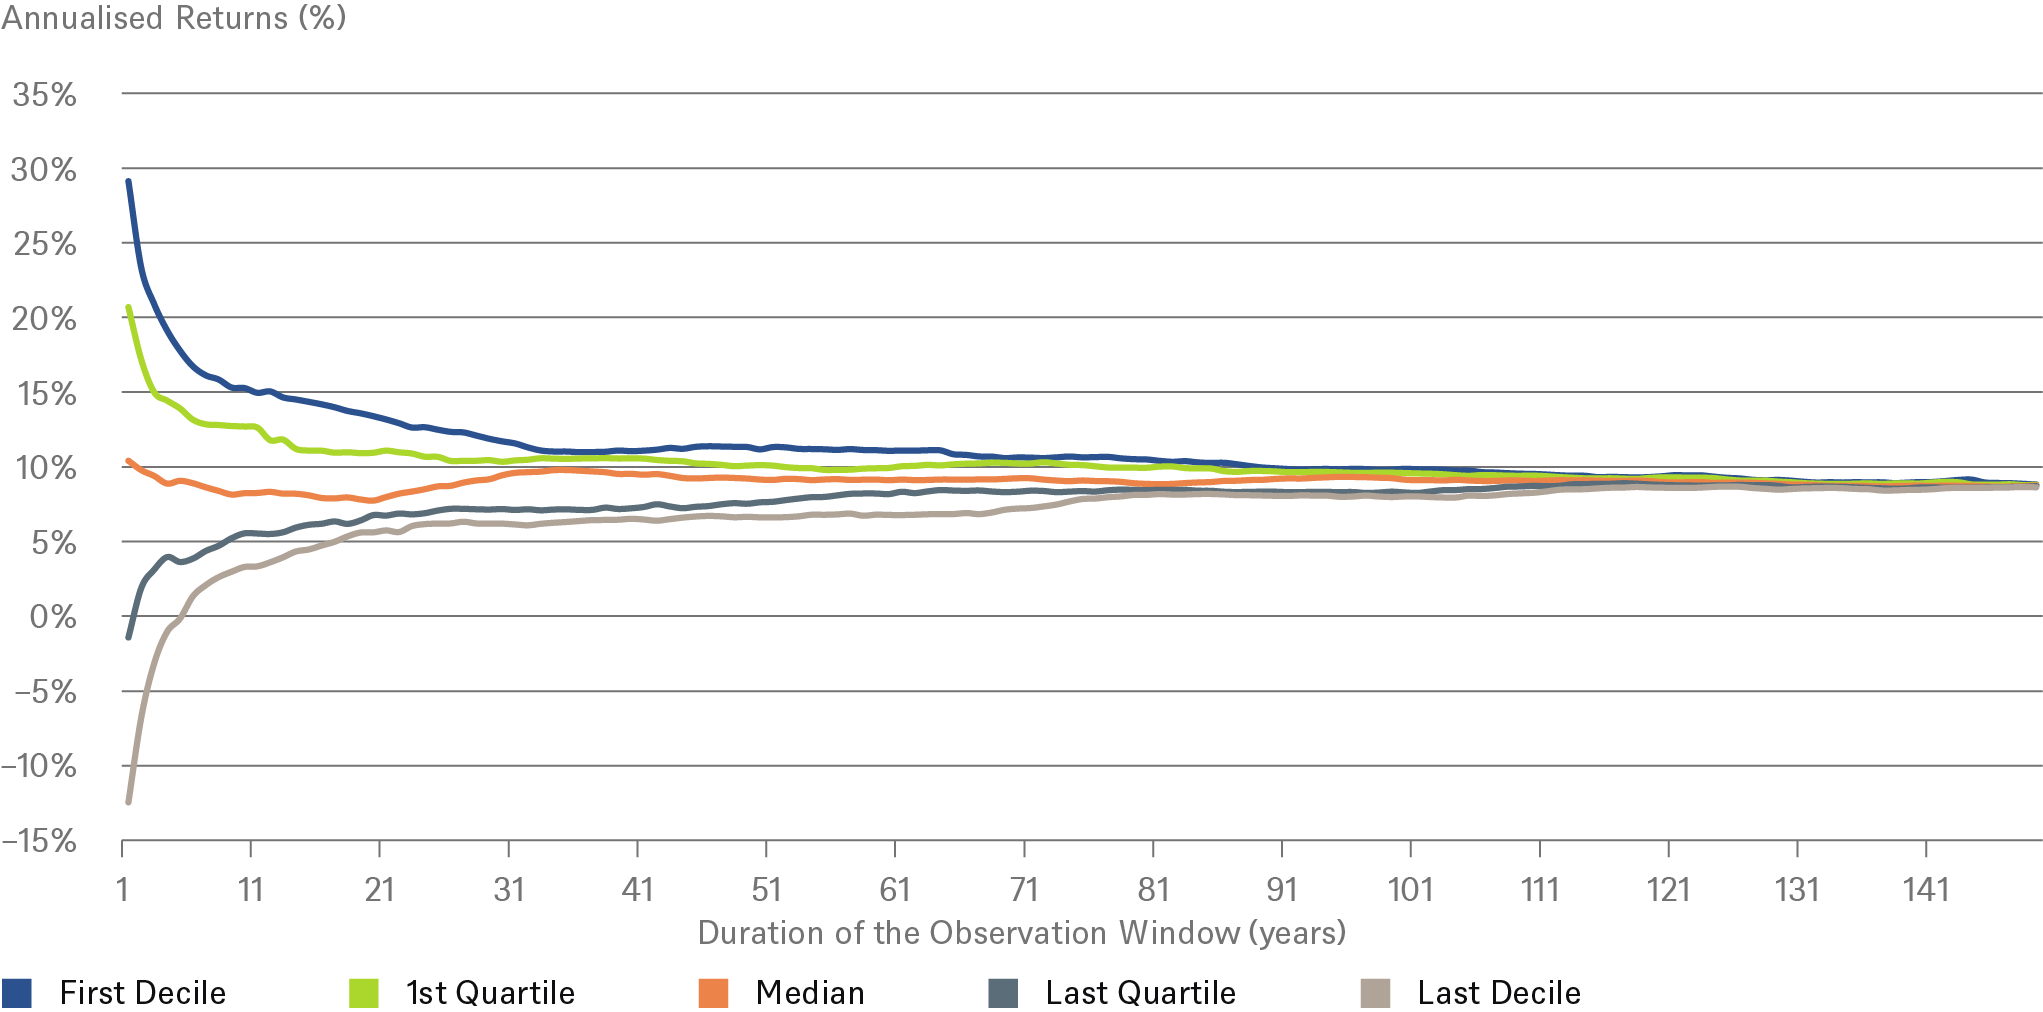
Source: Robert J. Shiller, DWS Investments UK Limited. Data from 1871 to 2021.
Framework
We use the same building-block approach to forecasting returns irrespective of asset class. We believe this brings consistency and transparency to our analysis and also may help clients better understand the constituent sources of returns.
The Long View framework breaks down returns into three main pillars: income + growth + valuation, each with their own sub-components.
The pillars and components for the traditional asset classes under our coverage (equities, fixed income and commodities) are show in Figure 14.
Meanwhile, alternative asset classes under our coverage (listed real estate, private real estate, real estate debt, listed infrastructure equity and private infrastructure debt) are forecasted using exactly the same approach, sometimes with an added premium to account for specific features, such as liquidity.
Long View for traditional asset classes: Pillar decomposition
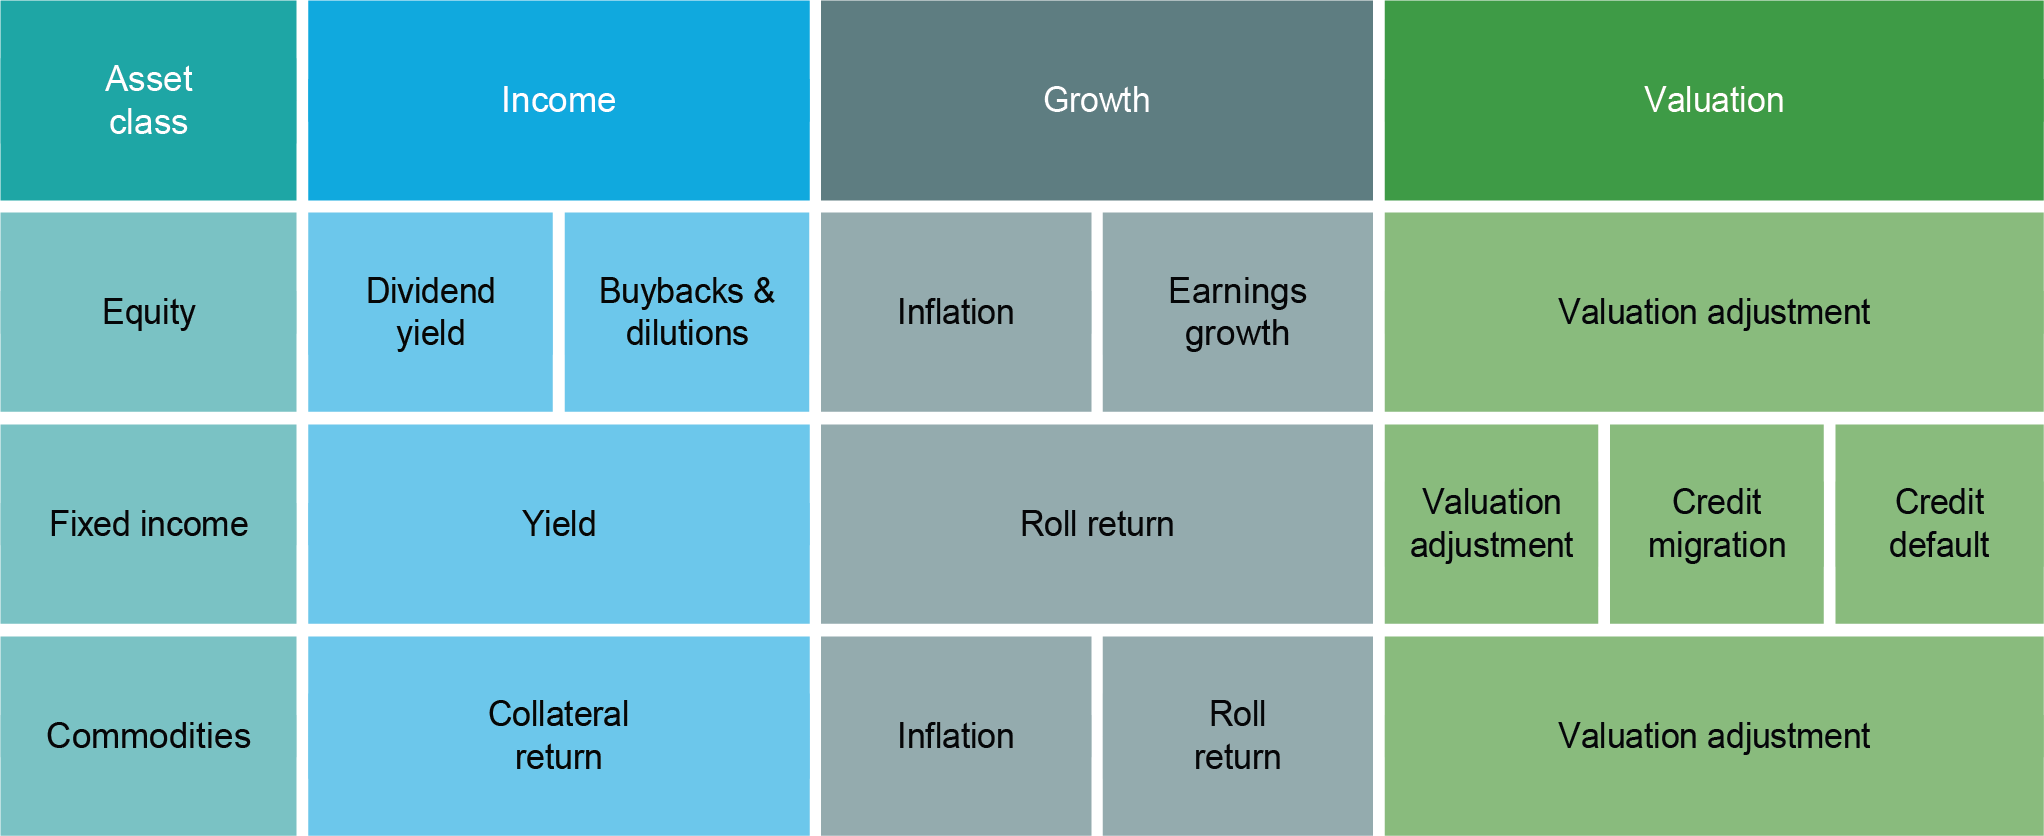
Source: DWS Investments UK Limited. As of 12/31/21.
Long View for alternative asset classes: Pillar decomposition
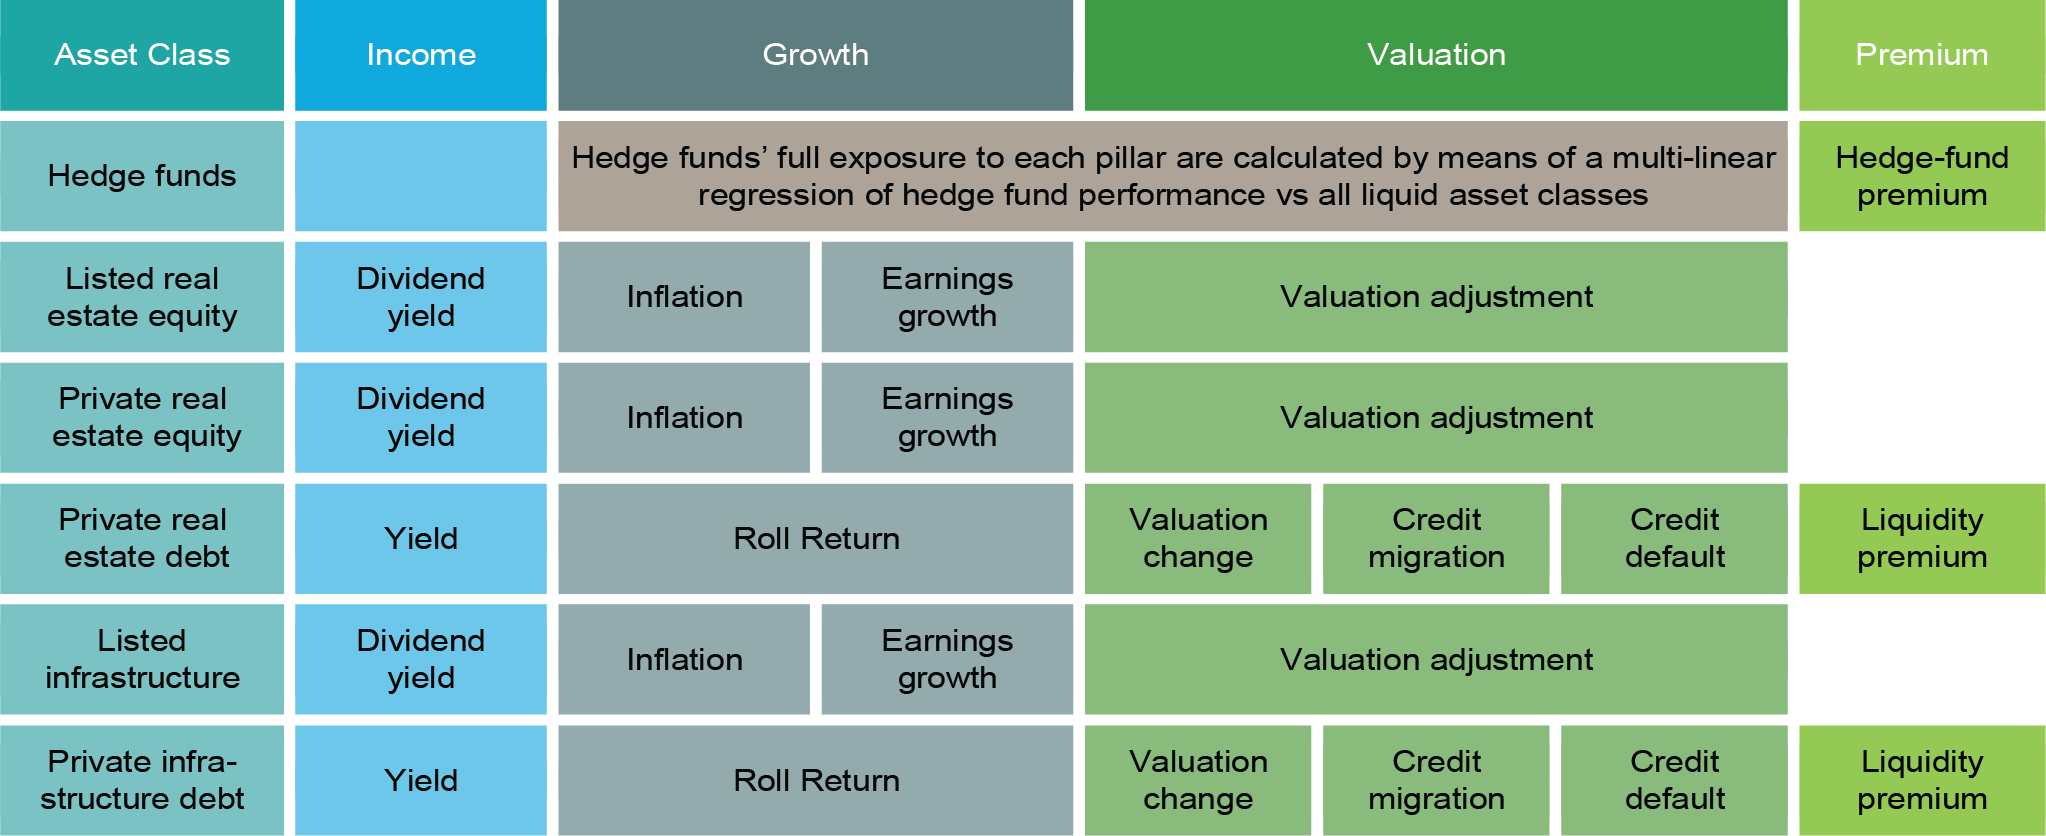
Source: DWS Investments UK Limited. As of 12/31/21.
Return forecasts
Our Long View forecasts for all asset classes can be seen below. The bars are ranked by ascending forecasted return within each asset class.
In summary, we make the following key observations from the results:
- Return forecasts in almost all asset classes are well below the returns achieved over the past decade, illustrating ongoing challenges for long-term investors.
- Across regional equity markets, the US and emerging markets are expected to offer the highest forecasted returns.
- ESG equity forecasts are modestly higher than are market cap-weighted indices across regions (see Table 2).
- Fixed income returns may be challenging, with emerging-market U.S. dollar (USD) sovereign and corporate bonds appearing to offer the highest forecasted returns.
- Relative to history, the return forecasts for credit (across IG and HY corporates as well as sovereign and corporate EMD) are near or below the lowest 10-year returns realized by these asset classes over the past several decades, including the financial crisis.
- Relative to many other asset classes, we forecast higher returns in many of the alternative asset classes covered (even though this premium has shrunk somewhat versus traditional risky asset classes); the highest return forecast in the major asset classes is currently found in private real estate.
- Return forecasts from commodities are low (especially in real terms) but they could provide useful diversification benefits.
- Investors should be conscious of the impact of foreign-exchange (forex) risk on base-currency returns and volatilities. Depending on risk appetite and return objectives, investors may want to consider hedging currency risk.
Forecast and realised returns for 10 years, annualised (local currency)
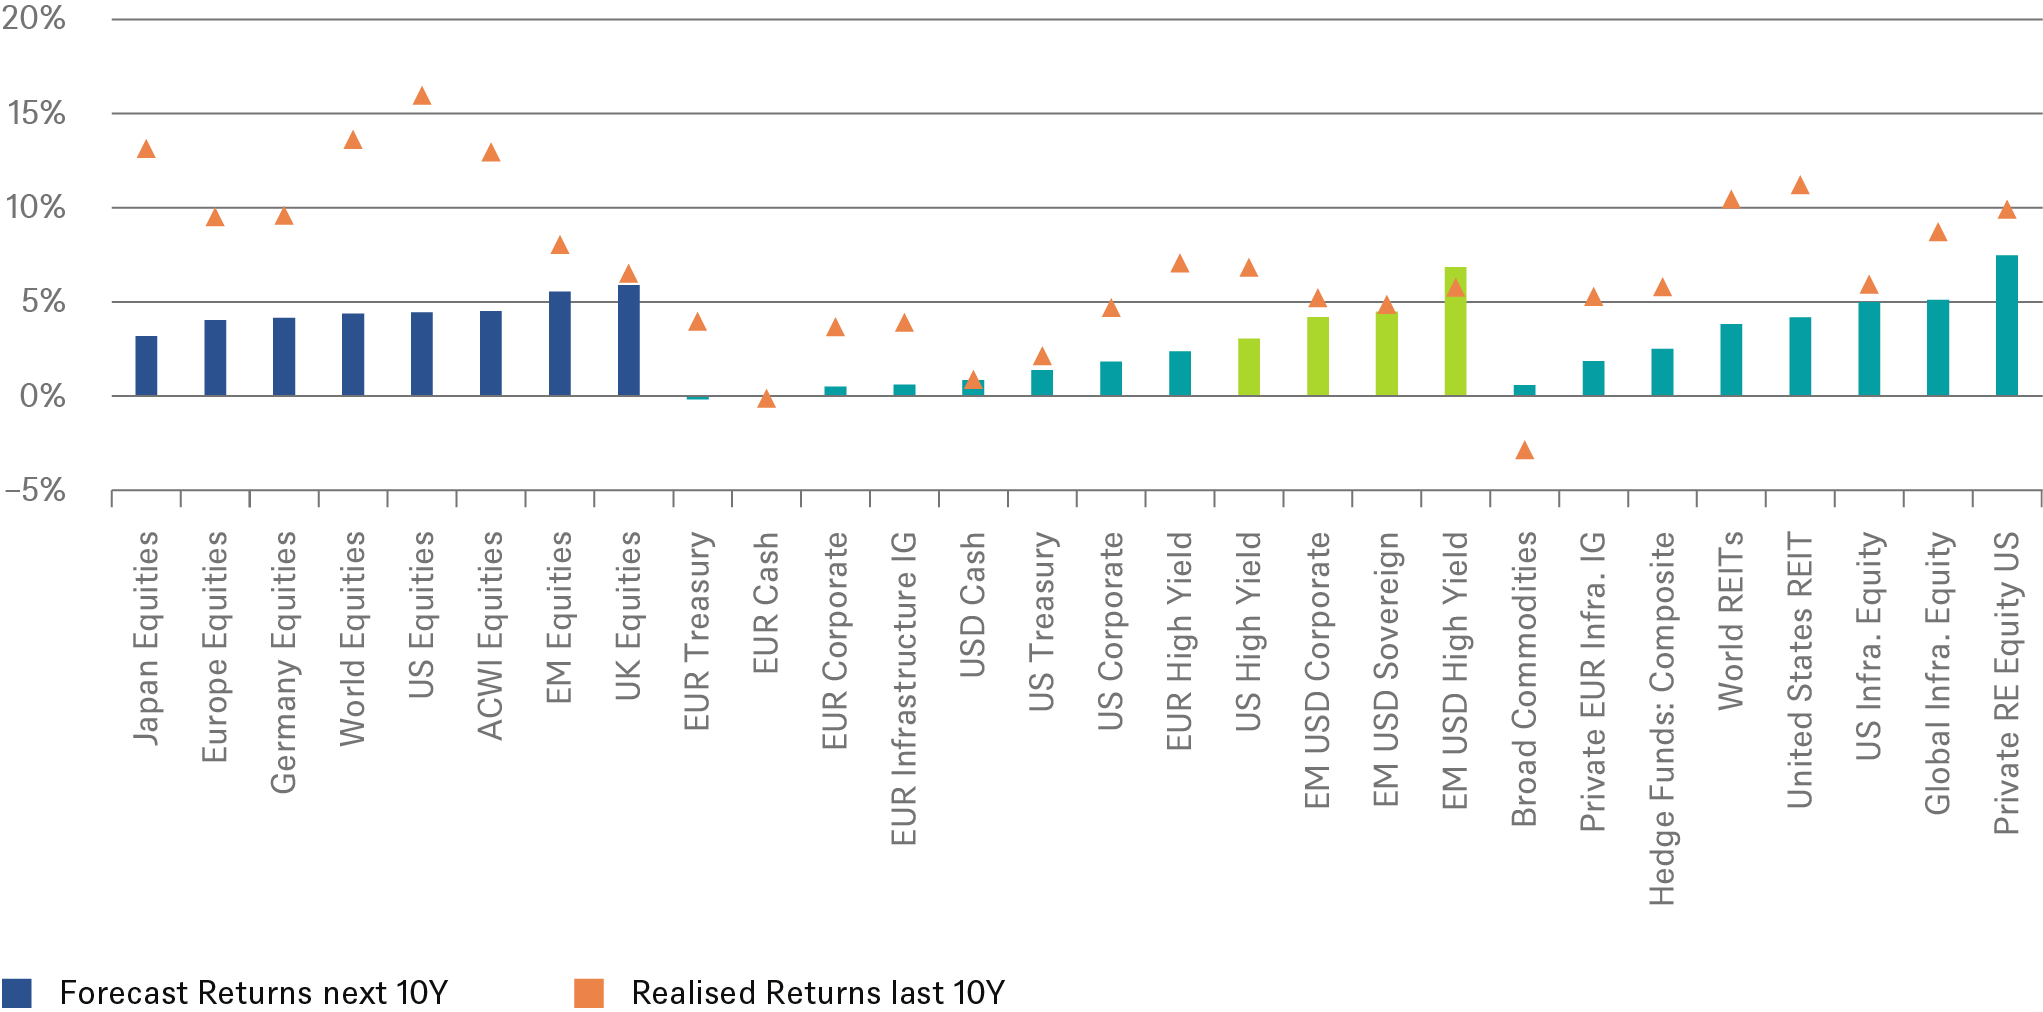
Source: DWS Investments UK Limited. As of 12/31/21. See appendix for the representative index corresponding to each asset class. Forecasts are not a reliable indicator of future performance. Forecasts are based on assumptions, estimates, views and hypothetical models or analyses, which might prove inaccurate or incorrect.
