- Home »
- Insights »
- CIO View »
- Chart of the Week »
- Carbon allowances correlations with European equities

Should it be free for companies to pollute as much as they want? Ask any economist and the answer will be a resounding no. Corporate decision making should face a carbon price that fully includes the social cost of their behavior. In Europe, at least, that has meant putting in place ambitious policies to reach emission reduction targets. Such proposals to tackle climate change remain controversial among U.S. policymakers, though California and several other US states operate their own carbon markets.[1] Still, Europe offers a fascinating test case on how carbon taxes and carbon markets use market forces to lead to reallocate resources in society so as to lessen pollution.
There are now 73 carbon tax and carbon market policies around the world, creating a price that encourages companies to cut emissions. Such policies cover ~23% of global emissions, a significant increase from ten years ago when only 7% of emissions faced a price on carbon. However, for most of these policies, the carbon price is far too low to reach emission reduction targets.[2] Expanding the coverage and strength of carbon price policies is an objective supported by many companies and investors.

Growing correlation between EU carbon allowances and European equities
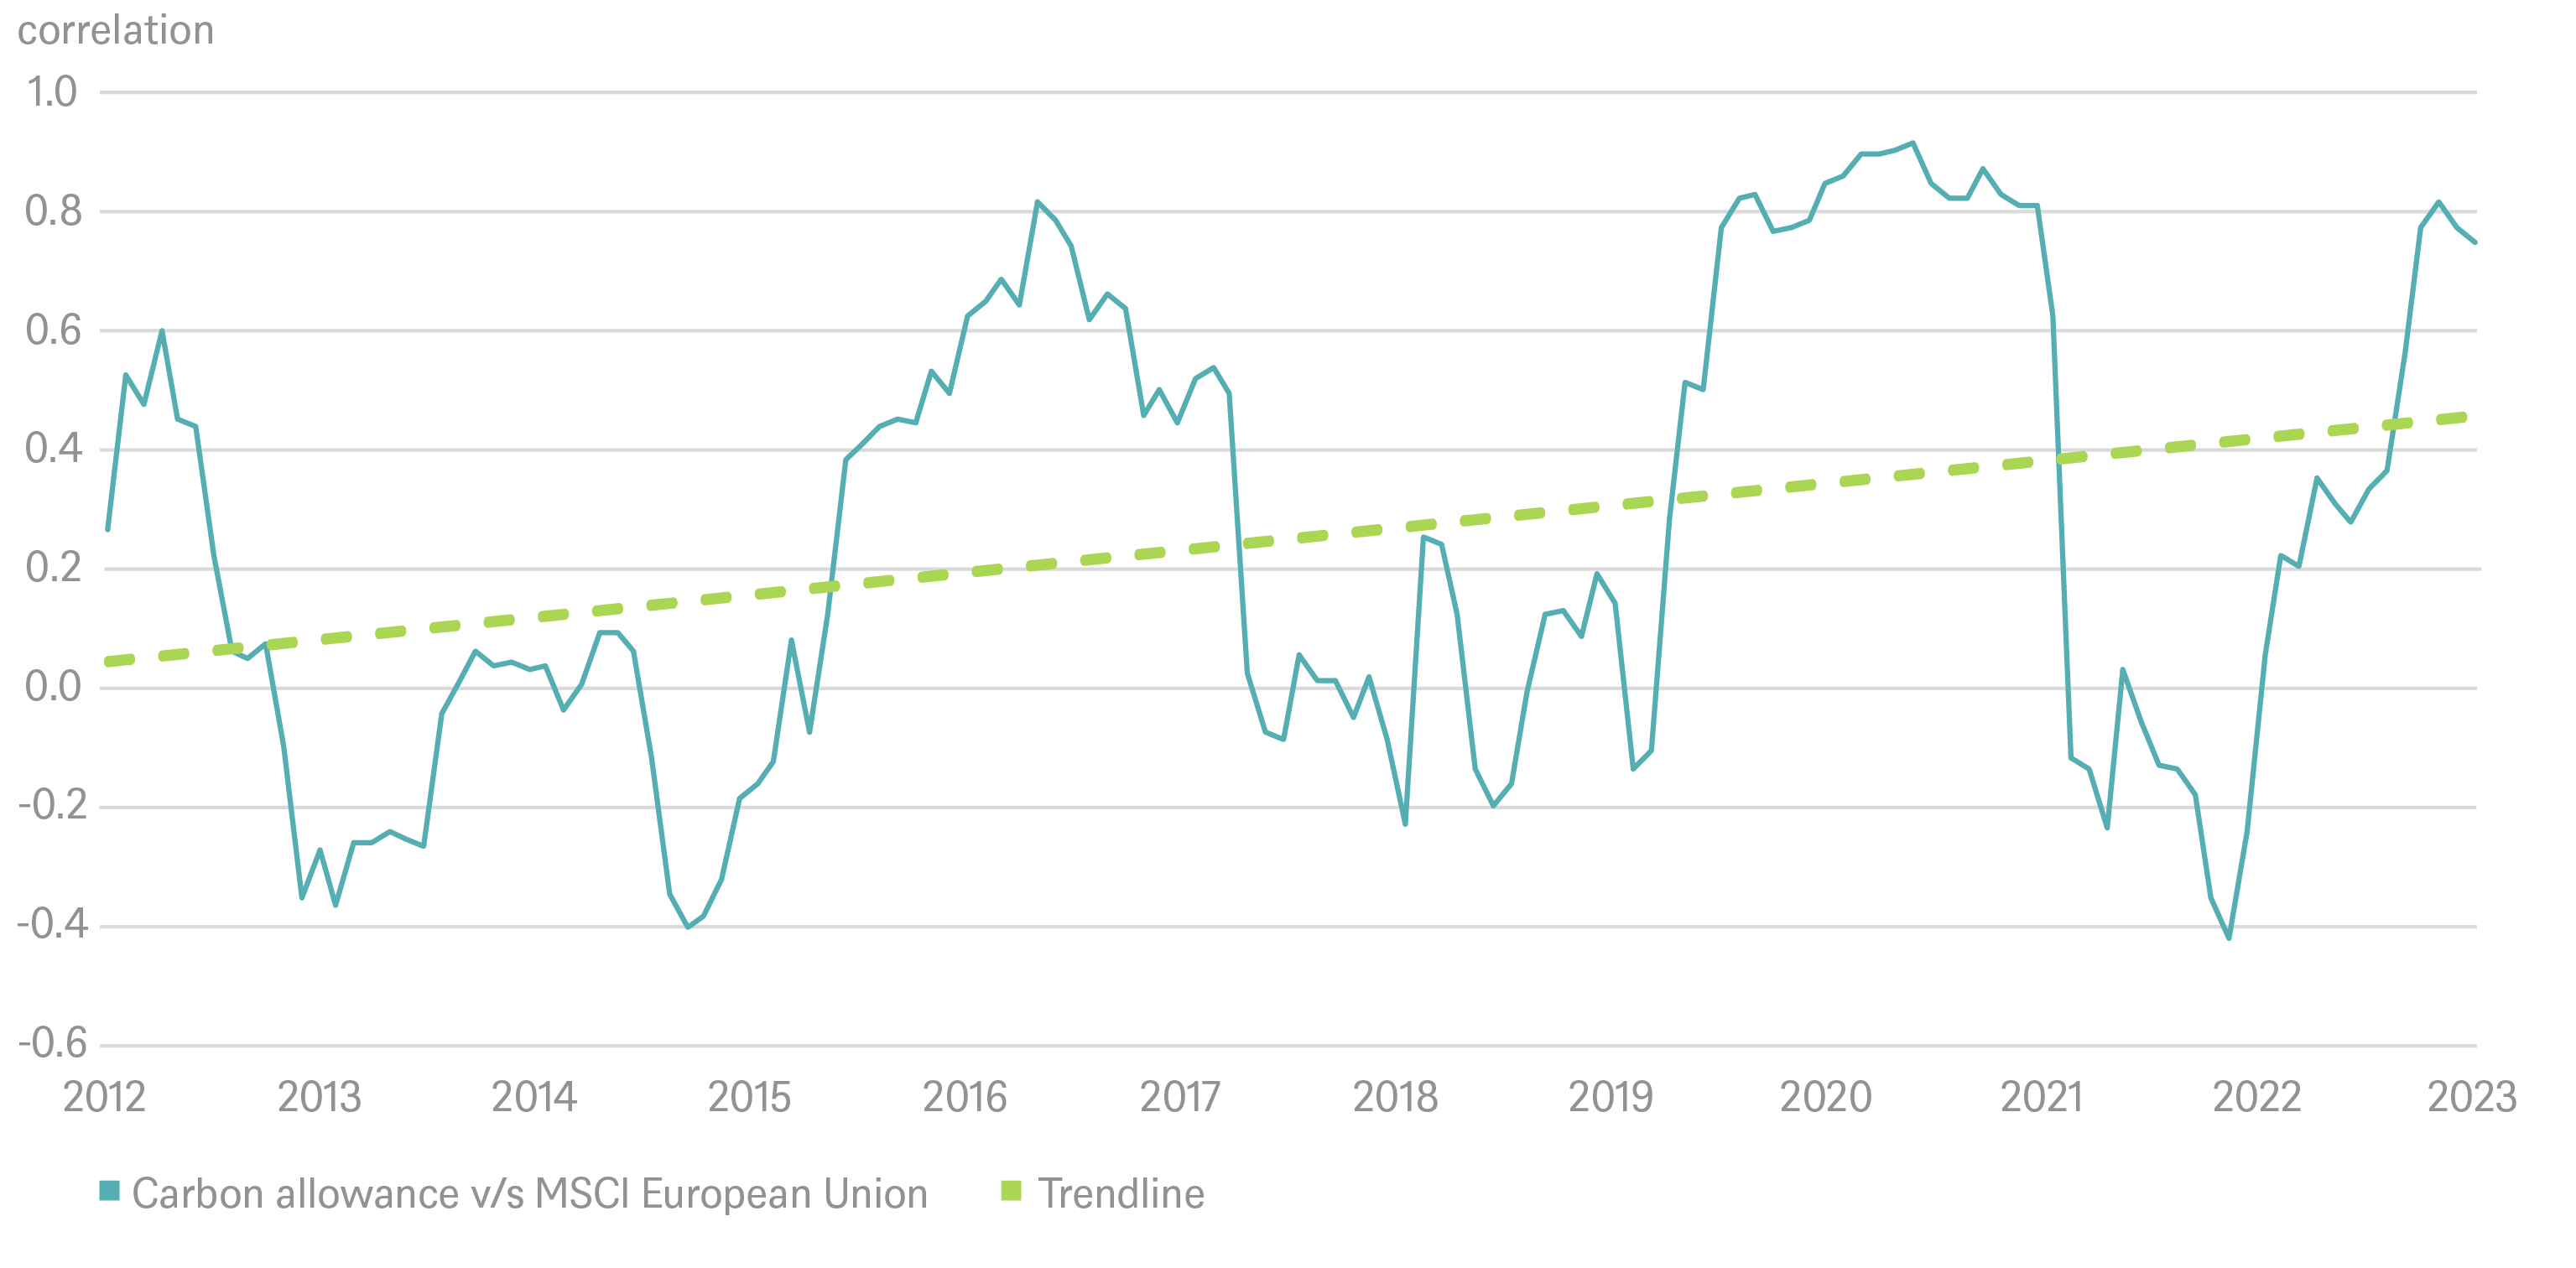
Sources: Bloomberg Finance L.P., MSCI, DWS Investment GmbH as of 11/7/23
The largest and most successful carbon market is in Europe where regulations require large companies to hold an ‘EU Allowance’ or permit for every tonne of emissions.[3]As Europe aims to cut emissions, every year there are fewer allowances available. Companies must thus buy allowances from other companies if they want to expand their business and not face steep penalties. As policymakers have steadily strengthened the Emissions Trading System (ETS) market rules, this has driven the EU Allowance price up to EUR 100 in March 2023.
The growth of the ETS market has caught the eye of investors, turning carbon into a new asset class. Our Chart of the Week shows that correlations of EU carbon allowances with European equities (as measured by the MSCI European Union index) have grown tighter over time. The ETS requires European power utilities, energy companies and large industrial companies to reduce their emissions. With reform and strengthening of the market that has occurred particularly after 2020, the correlation with indices covering European companies, as well as industrial and energy utility companies has grown. We will return to the precise causal mechanisms in future publications, but for now, notice another feature of our chart. “Correlations are sometimes positive, sometimes negative, highlighting the potential of carbon allowances to act as portfolio diversifiers and to hedge equities’ carbon price risks.”, argues Murray Birt, Senior ESG Strategist at DWS. “Investors need to pay more attention to the EU carbon market as an investment opportunity, risk factor and as a policy to accelerate emission reductions”.
The EU’s official report also concludes that the ETS is working as intended. The ETS has helped reduce emissions from power generators and industry by 37% below 2005 levels. The market has helped governments raise EUR125bn from auctioning allowances to utilities. Countries have used this revenue to accelerate the low-carbon energy transition and to help protect consumers.[4] A forthcoming DWS report will update past research on the EU carbon market. For instance, we also find that volatility of the carbon price has continued to decline, as the market matured. Of course, great care needs to taken in how to interpret patterns of past data when drawing inferences for the future, particularly when causal mechanisms are somewhat murky.[5] Still, Europe’s experiences with carbon allowances offers fascinating insights, not just for U.S. and international policymakers, but for global investors too.


