- Home »
- Insights »
- CIO View »
- Investment Traffic Lights »
- Investment Traffic Lights

- The past year was surprising in many respects - ultimately in advantagous ways, as almost all financial assets generated decent returns.
- The pronounced year-end rally of 2023, which was based primarily on fresh hopes of interest rate cuts in 2024, was partly responsible.
- Given the once again impressive valuations, the bar for a good investment year in 2024 is quite high. The markets are likely to react very sensitively to any disappointments, say on inflation or economic growth.
1 / Market overview
1.1 Trading begins in 2024 at levels where we had expected the 2024 year to end.
The way 2023 ended is likely to pose a dilemma for many market strategists. They usually prepare their annual outlook around mid-November. Back then, the end-of-year rally had already started, but the extent of it must have surprised almost everyone and now poses the question: should one maintain the absolute price targets and thus let the return potential melt down to zero? Do you instead adapt your 2024 forecast framework to the optimistic market movements and thus make a soft landing for the (U.S.) economy the main scenario - i.e. only a short, slight deceleration in economic output while at the same time sustainably low inflation rates? Or should some economists and other market experts perhaps refrain from making overly precise forecasts altogether, given the many forecast failures in recent years? Before we get into that, let’s first review 2023.
The year was not without surprises. In contrast to the previous year, 2022, inflation rates in 2023 moved in the direction most predicted. What was surprising was, on the one hand, the robust U.S. growth. This can be clearly seen in the expectations of the strategists surveyed by Bloomberg. Their estimates for 2023 growth fell from 2.5% over the course of 2022 to 0.3% at the turn of the year, only to rise again to 2.4% over the course of 2023. Interest rates were also surprising, as they continued to rise with alarming determination until the end of October. This rise was only slowed briefly in the spring, when the difficulties in the U.S. banking sector prompted the Federal Reserve (Fed) to inject new liquidity. Otherwise, until mid-autumn, it seemed plausible that longer-term sovereign bonds of many countries could experience a third consecutive year of losses - an extraordinary rarity in the developed world. A further surprise came from the stock markets, which also developed well despite ever-increasing interest rates. And, again surprisingly, it was primarily supported by the big U.S. technology stocks increasingly known as the “Magnificent Seven” or “Great Eight“, depending on which ones and how many a given strategist decides to include. The reason for the surprise among many is that these stocks have actually been relatively interest rate sensitive in the immediate past. On average, they doubled their market value in the past year and thus contributed two-thirds of the increase in the value of the entire S&P 500. Many investments saw the hype surrounding artificial intelligence as a key catalyst. For the sake of completeness, it should also be mentioned that these seven stocks lost almost half of their value in 2022, so that they only gained slightly over the two-year period.
The fourth quarter was a real roller coaster ride. The attack by Hamas on Israel, uninspiring quarterly figures and cautious rhetoric from the central banks coincided with bond and share prices sliding in October. Then, the year-end rally began shortly before the end of that month following statements from Fed members that suggested that not only had the end of the interest rate hike cycle definitely been reached, but that interest rate cuts for 2024 were already part of the discussions in the steering committee, the FOMC.
1.2 Only a few losers in 2023, with some big winners
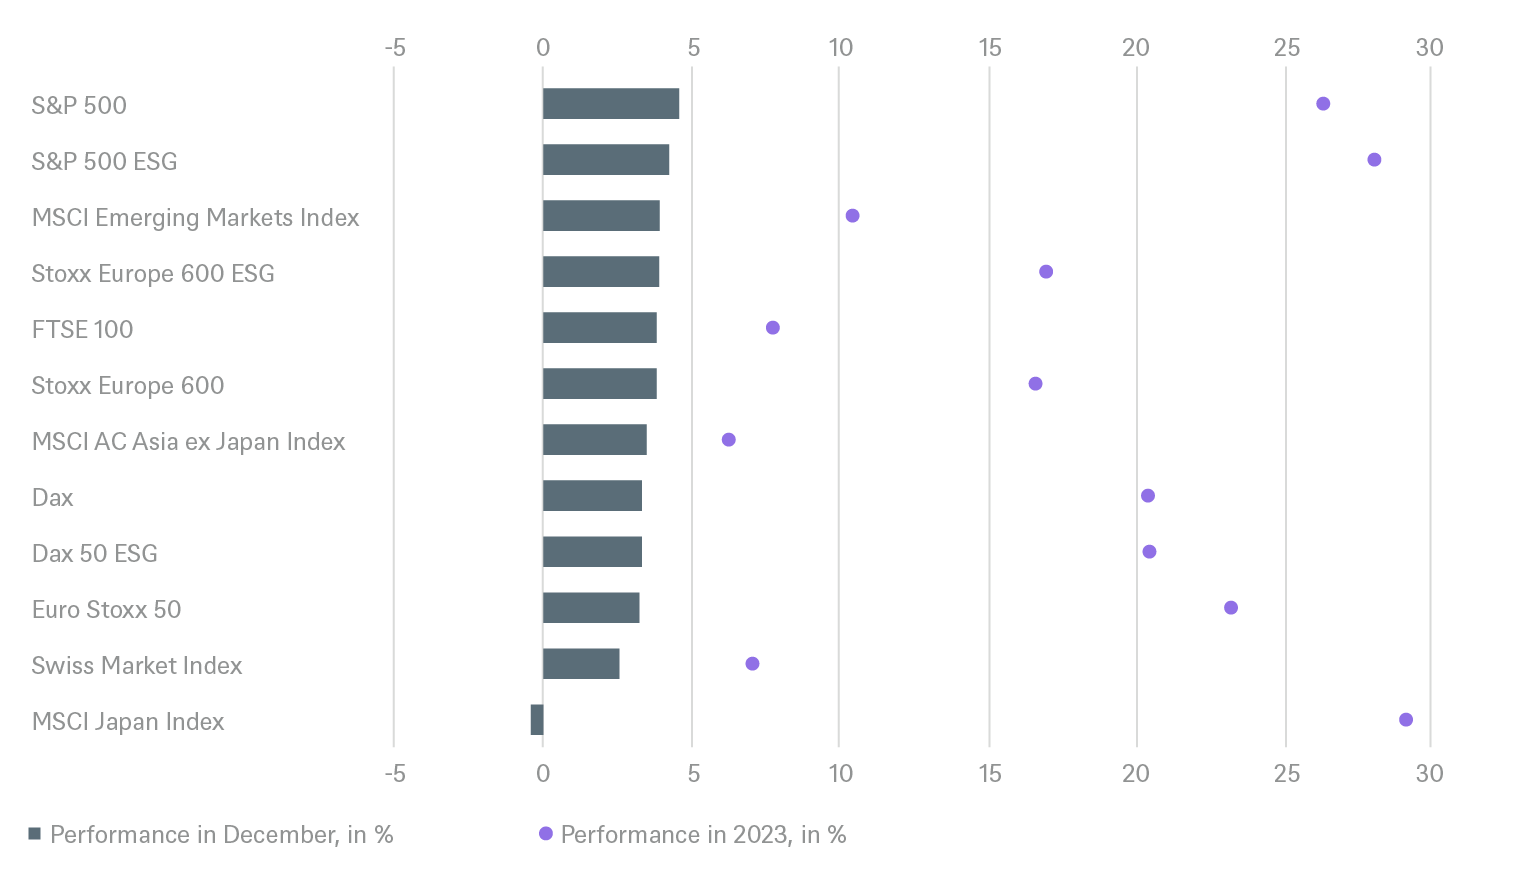
The year-end rally of 2023, which began on October 27th, rejigged the entire year's results. It ensured that only a few asset classes ended in the red: the Hang Seng lost 1% , and - almost logically - raw materials also lost an average of 12%, driven by the surprisingly weak oil price (despite the Middle East conflict) (Brent lost 10%).[1] China was unable to sustainably get the problems in the real estate market under control and the country’s leadership also refrained from putting together a stimulus package in the way it used to during previous downturns. Added to this was the never-ending trade conflict with the USA and, to some extent, Europe. As a result, the Asia region performed the weakest among the emerging market stock indices at 6%, while Latin America was strong at 25% and Eastern Europe at over 40%.[2] Winners wherever else one looks among major stock markets. In terms of stock indices, the increases since October 27th alone have ranged from 15% for the Nikkei 225 to 19% for the Dax, with the Stoxx 600 and the S&P 500 showing gains in between. For the entire year, technology stocks once again dominated, with the Nasdaq achieving its best result since 1999 with an increase of 5%. The growth segment, with an increase of 43%, left the value stocks (12%) far behind. The small caps also performed relatively weakly compared to the heavyweights: Stoxx 200 Small Cap 8%, 15% for the Russell 2000, even if their strong year-end spurt gives hope for more in the current year. Cryptocurrencies were at the top of the winners, despite all the upheavals among important market participants. Bitcoin, for example, was able to gain over 150%, probably also supported by the approval of financial instruments based on cryptocurrencies by the U.S. Securities and Exchange Commission.
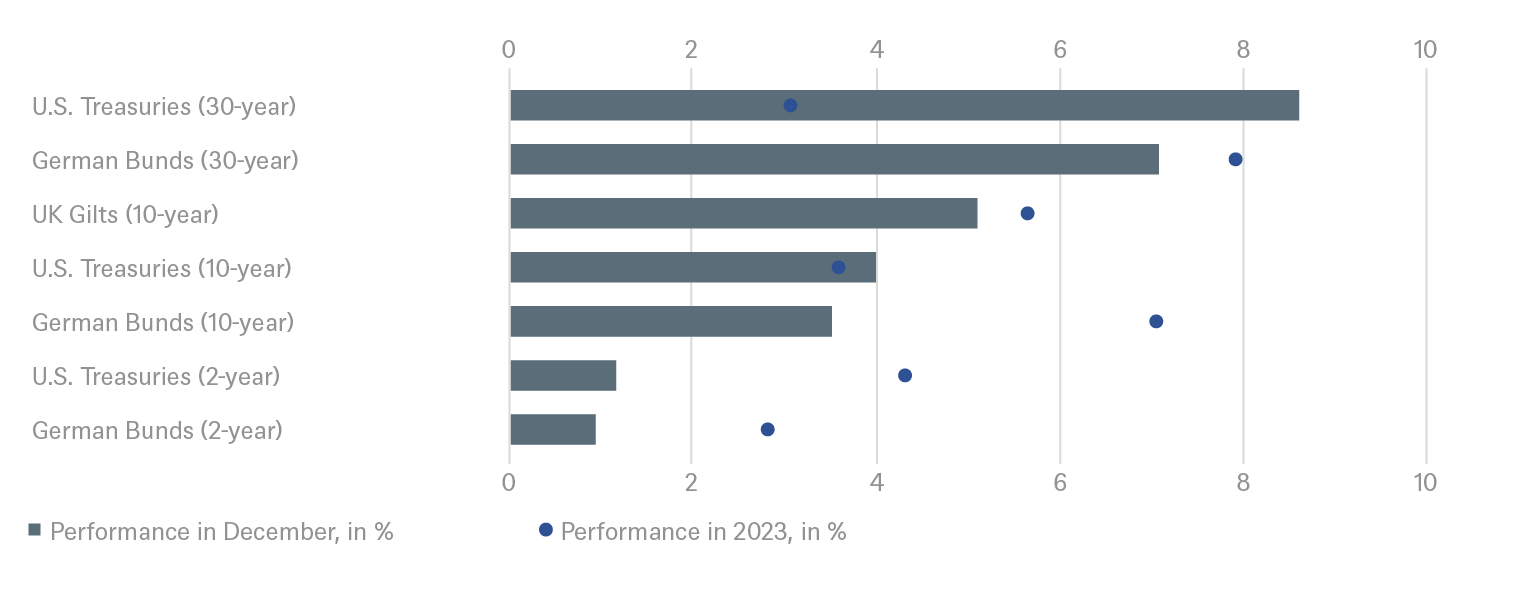
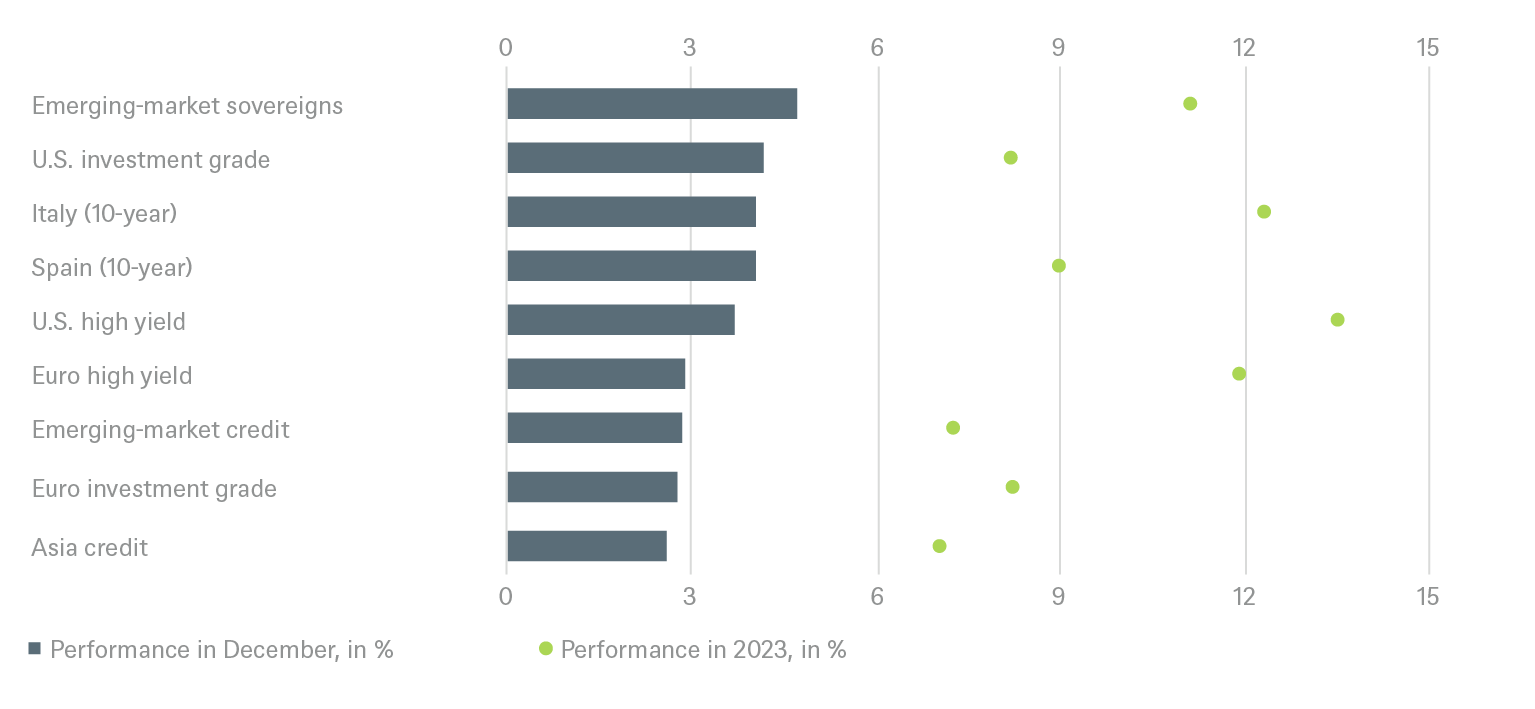
Beyond that, bonds were of course the eye-catchers last year, after having suffered two negative years in a row - which is already rare enough in history. The current yield was finally attractive again – U.S. Treasuries occasionally yielded a current yield of over 5% (the annual return across all maturities was also over 5%, for the first time since 2000), U.S. high-yield bonds almost 10% and European investment grade corporate bonds almost 5%. In contrast to the sharp drop in yields at the end of the year, there was only one direction for central banks in 2023, even if the momentum weakened towards the end - upwards. Over the course of the year, the European Central Bank (ECB) increased the deposit rate from 2 to 4%, and the Fed increased the upper end of its funds from 4.5 to 5.5%. Core inflation took the other direction, falling from 5.6 to 4.0% in the U.S. from January to November and from 5.4 to 3.6% in the Eurozone.
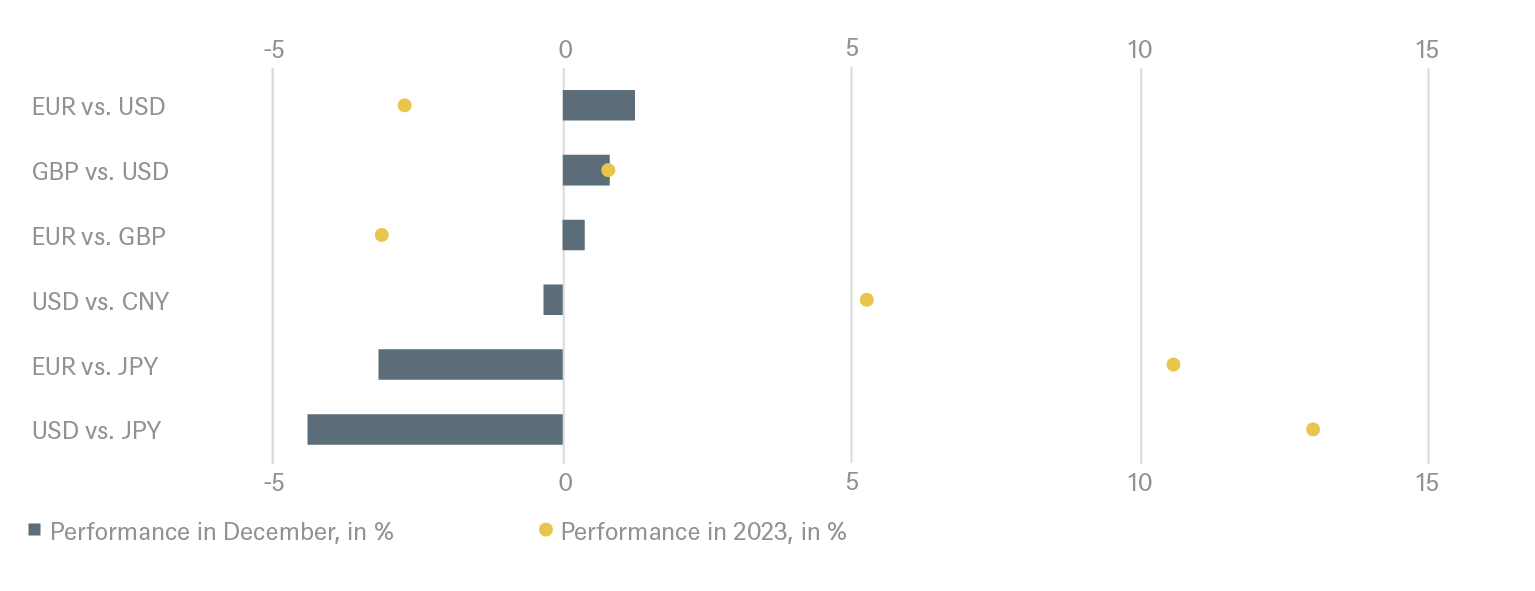
The unusual features in 2023 also included market volatility. As a result of the U.S. banking crisis, the MOVE Index, which is based on U.S. government bonds, recorded its highest levels since the 2008 financial crisis in March and ended the year well above its average over the past ten years. Fluctuation in stocks painted quite a different picture. The VIX index, based on the S&P 500, is at its lowest level since the outbreak of the Covid crisis and well below its ten-year average. Turkey should also be mentioned as an interesting outlier, whose currency depreciated sharply against the dollar: while at the beginning of 2023 you were getting less than 19 lira per dollar, by the end of the year it was almost 30 Lira. The dollar-denominated Turkish bonds (JP EMBI Index) rose by 16%, the best showing within the ten constituents of the JP Morgan EMBI Global Diversified Bond Index.
2 / Outlook and changes
Clearly, the outlook for the year 2024 as a whole is not easy when the end-of-year targets for '24 have been set almost two months ago and have been largely achieved. This is even more true for the short-term outlook. A clear, positive narrative has prevailed among market participants; now the macroeconomic reality must follow this. First and foremost, of course, this concerns the growth and inflation data from the USA. Even though our outlook for 2024 was positive overall, we now view the markets with a certain degree of skepticism, especially since we expect more headwinds for the U.S. economy than the markets are now pricing in. Because one possibility should not be ruled out: that the Fed has its own narrative. Namely the concern that the economy would cool down too much, which is why the central bank willingly allowed market forces to improve the financing conditions through the decline in yields. Overall, however, the interest burden for most companies in 2024 is likely to be above the 2023 levels.
2.1 Fixed Income
We continue to expect interest rate cuts by the Fed and the European Central Bank (ECB) from the second quarter of 2024 onwards. However, mixed data in the U.S. and the sharp decline in 10-year Treasury yields in the fourth quarter of 2023 urge caution. The coming months are likely to be characterized by significant fluctuations. That's not all that unusual. Market participants have historically often been quite fickle as the Fed begins to approach the end of its rate hike cycle. It means being flexible. In corporate bonds in particular, we would view any temporary spread widening as a buying opportunity, not least as the fundamentals of many companies continue to look solid, but also be patient for such opportunities.
Government Bonds
The U.S. Treasury bond market is likely to continue to react sensitively whenever there are new developments on the U.S. economy, inflation expectations and the Fed's likely view on both. The last 6 months have clearly shown how quickly market participants are willing to change their collective mind, even without too many actual, lasting changes. There is generally something to be said for 2-year Treasury bonds, whose yields are less sensitive to such sentiment swings than their 10- and 30-year Treasury counterparts. A similar logic holds for the Eurozone, the difference being that yields on 2-year German Bunds remain much stingier than their U.S. counterparts, at about 2.5%. Here, nimbleness is required even at the short end. We are currently neutral, but can easily imagine markets pricing in too many interest rate cuts or too few for next year, not least as growth prospects do not appear rosy. Meanwhile, government bonds from Italy and especially Spain continue to offer a significant yield premium compared to federal bonds.
Investment Grade Credit
For U.S. Investment Grade (IG), a growing belief that the Fed is done raising interest rates has pushed up valuations. There are now signs of a significant increase in new U.S. issues in January. We would expect spreads to widen again, at least temporarily. Despite overall solid fundamentals and relatively good economic backdrop, we are tactically very cautious. That said, the positive, longer-term investment properties of the asset class remain intact. In Europe, we continue to see corporate hybrids as particularly attractive and prefer senior bonds from the banking sector.
High Yield Credit
After the strong 2023 year-end rally, market participants have priced in a veritable Goldilocks environment for High Yield (HY) bonds. This increases the risk of significant corrections in the next few months. After all, there are still considerable uncertainties regarding inflation, economic growth and, for individual sectors, geopolitics. At current levels, it may not take much of an increase in risk perceptions for yields to suddenly appear insufficient to compensate for these risks. In the U.S., new issuance volumes also recovered in December, while cash inflows into the segment fluctuated sharply throughout 2023. Investors should prepare for higher volatility in the near term. Particularly in Europe, it remains to be seen how much pricing power some companies can demonstrate in the new environment. Caution seems warranted here in the first quarter.
Emerging Markets
In this segment too, the interest rate turnaround now seems to be priced in. Given current tight overall spreads, thoughtful analysis and prudent investment management remain key. We continue to prefer solid issuers with attractive valuations, particularly in Asia. At the same time, overall cash inflows remained inconsistent, while primary supply developed solidly. For the asset class as a whole, we are waiting for more attractive entry levels, while remaining vigilant for selective opportunities.
Euro vs. dollar
Given the seasonal low liquidity, we assume that volatility on the foreign exchange market will also increase again. The dollar could benefit from this to some extent. Nevertheless, we do not expect the greenback to break out of the relatively narrow range of the past few months at the beginning of the year.
2.2 Equities
In mid-November, we gave a constructive stock market forecast for 2024 with high single-digit upside potential in all regions. We had argued that investors would look past the current economic downturn and instead "focus on the light of the tunnel" triggered by prospects of a soft economic landing, monetary easing and high single-digit EPS growth.
A month later, Christmas 2024 had already come a year early for equity investors: Boosted by the decline in U.S. 10-year yields of more than 100 basis points, risky assets have already met or exceeded most of our 12-month index targets. At this stage, we are reluctant to make any changes to our 12-month targets. After all, the three core assumptions that underpin them remain intact, at least for now. To boost equity markets beyond year-end levels, a significantly lower U.S. yield forecast than the current 4.2% for December 2024 would clearly help, but appears hard to justify. Alternatively, our below-consensus profit forecasts would have to rise. However, a quick cross-check with our DWS regional and sector specialists makes this an unlikely scenario at this time. On the contrary, we expect that most companies will still provide conservative guidance for 2024 in the fourth quarter earnings season, as high interest rates and increasing consumer frugality hurt earnings. Finally, and thirdly, if you look at the U.S. equity risk premium (ERP), the current VIX value of 12 already indicates very low risk awareness among investors in the 90th percentile. Equity risk premiums outside the U.S. appear less demanding, supporting our comparatively positive view on Europe and Japan.
As we stick to our 12-month equity index targets, we would not be chasing the market here. We believe weak incoming macro data, market disappointment over early Fed cuts, fears of Donald Trump returning to the White House and overly optimistic consensus expectations in the U.S. corporate earnings may well provide better entry points for tactical equity investors in coming months.
Based on relative sector valuations, we maintain our preference for Communications (Overweight) over IT (Neutral) and Consumer Discretionary (overweight) over Consumer Staples (neutral) due to better pricing and improving inventory dynamics among the former group. Also, we have upgraded listed real estate from underperform to neutral.
Long-term equity investors are unlikely to care all that much about the above granularity. Instead, they are likely lay back and look at the prospects of three years of monetary loosening ahead of us; they may trust in continued innovation that keeps earnings growing; and they will probably keep their faith in the long-term benefits of compounding and global diversification.
U.S. Market
We continue to expect that the anticipated Fed pivot is likely to trigger a broadening of market leadership beyond the big U.S. technology stocks increasingly known as the “Magnificent Seven” or “Great Eight“, depending on which selection one prefers during the course of 2024. Some of this has already materialized in recent weeks, in anticipation of the Fed’s completion of the hiking cycle. We expect at least one more leg to this broadening as equity investors start discounting the timing and profile of Fed rate cuts more precisely.
European Market
We maintain our strong outperform rating on European small and midcap companies. In this area in particular, there are still solid companies that appear attractive even after the good performance of the past few months.
Japan
Japan remains attractive, not least as investors have finally begun to give credit for improvements in corporate governance many years in the making. In terms of valuation and as an Asian alternative to Chinese stocks.
Emerging Markets
We are positive about emerging markets. Our focus is on selected Asian stocks from the consumer, technology and financial sectors, not least from India, through which you can participate in the growth of the world's most populous country. Overall, we prefer companies with greater pricing power and defensive characteristics. Despite the evolving economic cycle, we remain cautious for sectors with structural problems and companies with weak balance sheets.
2.3 Alternatives
Real Estate
Listed real estate companies have recently recovered significantly and we have upgraded the sector from underperform to neutral, as noted above. When it comes to real estate transactions, however, it will probably take some time to bottom out. Fundamentals remain solid, with low vacancy rates and strong rental growth across most sectors and regions.
Gold
We expect gold prices to continue to recover, boosted by approaching U.S. interest rate cuts. Geopolitical risks, or at least their perception among market participants, are also unlikely to diminish by the end of 2024. Extensive purchases by central banks are also likely to continue and support the price of gold.
Oil
We also expect oil prices to increase over the 12-month period; our forecast for Brent is USD88 per barrel at the end of 2024, compared to around USD 78 recently. We have not yet penciled in any significant supply disruptions from the Middle East due to geopolitical conflicts, we are monitoring current events, notably in Iran, very closely.
2.4 DWS High Conviction
Even though our outlook for 2024 was positive overall, we now view the markets with a certain degree of skepticism as the year actually gets started. Too much good news seems to be already pricing in, while there is no shortage of possible negative catalysts that could trigger corrections. This means being flexible and selective, both with corporate bonds and stocks. In order to take advantage of pullbacks, thorough fundamental analysis is more worthwhile than ever, especially for small caps outside the USA. We continue to consider European small and mid-cap companies to be particularly attractive, especially in a longer term perspective.
3 / Past performance of major financial assets
Total return of major financial assets year-to-date and past month
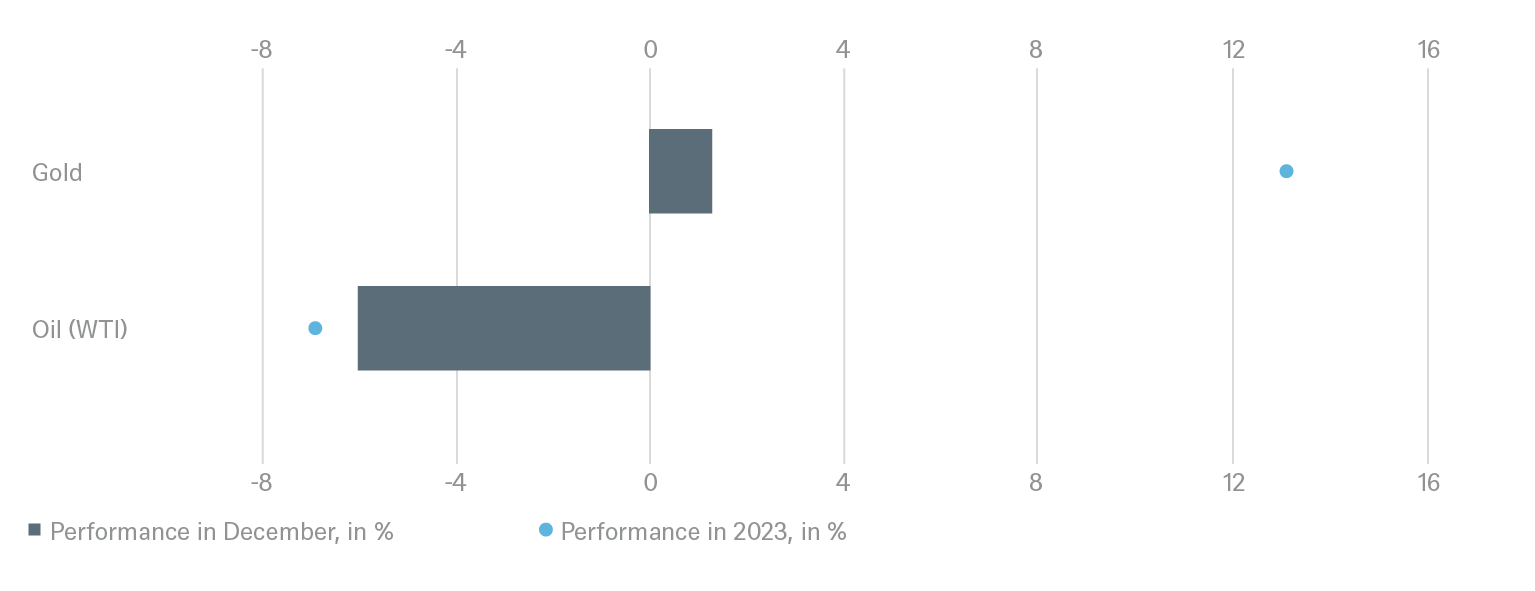
Past performance is not indicative of future returns.
Sources: Bloomberg Finance L.P., DWS Investment GmbH as of 12/31/23
4 / Tactical and strategic signals
The following exhibit depicts our short-term and long-term positioning.
4.1 Fixed Income
Rates |
1 to 3 months |
through Dec 2024 |
|---|---|---|
| U.S. Treasuries (2-year) | ||
| U.S. Treasuries (10-year) | ||
| U.S. Treasuries (30-year) | ||
| German Bunds (2-year) | ||
| German Bunds (10-year) | ||
| German Bunds (30-year) | ||
| UK Gilts (10-year) | ||
| Japanese government bonds (2-year) | ||
| Japanese government bonds (10-year) |
Spreads |
1 to 3 months |
through Dec 2024 |
|---|---|---|
| Spain (10-year)[3] | ||
| Italy (10-year)[3] | ||
| U.S. investment grade | ||
| U.S. high yield | ||
| Euro investment grade[3] | ||
| Euro high yield[3] | ||
| Asia credit | ||
| Emerging-market credit | ||
| Emerging-market sovereigns |
Securitized / specialties |
1 to 3 months |
through Dec 2024 |
|---|---|---|
| Covered bonds[3] | ||
| U.S. municipal bonds | ||
| U.S. mortgage-backed securities |
Currencies |
1 to 3 months |
through Dec 2024 |
|---|---|---|
| EUR vs. USD | ||
| USD vs. JPY | ||
| EUR vs. JPY | ||
| EUR vs. GBP | ||
| GBP vs. USD | ||
| USD vs. CNY |
4.2 Equity
Regions |
1 to 3 months[4] |
through Dec 2024 |
|---|---|---|
| United States[5] | ||
| Europe[6] | ||
| Eurozone[7] | ||
| Germany[8] | ||
| Switzerland[9] | ||
| United Kingdom (UK)[10] | ||
| Emerging markets[11] | ||
| Asia ex Japan[12] | ||
| Japan[13] |
Style |
1 to 3 months |
|
|---|---|---|
| U.S. small caps[24] | ||
| European small caps[25] |
4.4 Legend
Tactical view (1 to 3 months)
The focus of our tactical view for fixed income is on trends in bond prices.Positive view
Neutral view
Negative view
Strategic view through December 2024
- The focus of our strategic view for sovereign bonds is on bond prices.
- For corporates, securitized/specialties and emerging-market bonds in U.S. dollars, the signals depict the option-adjusted spread over U.S. Treasuries. For bonds denominated in euros, the illustration depicts the spread in comparison with German Bunds. Both spread and sovereign-bond-yield trends influence the bond value. For investors seeking to profit only from spread trends, a hedge against changing interest rates may be a consideration.
- The colors illustrate the return opportunities for long-only investors.
Limited return opportunity as well as downside risk
Negative return potential for long-only investors


