
- Recent data on the U.S. economy supports suggestions that the Fed is well on its way towards eventually winning the fight against inflation.
- The fate of the labor market therefore remains crucial for the outlook on (service ex. shelter) inflation.
- Sticky wage growth might be the reason why the unemployment rate should overshoot its equilibrium value of 4%.
Superficially, recent data on the U.S. economy supports suggestions that the U.S. Federal Reserve (the Fed) is well on its way towards eventually winning the fight against inflation, which not so long ago appeared stubbornly high. And to be sure, lower inflation rates are good news, all else equal. However, we would like to highlight in this note that a substantial amount of uncertainty remains on the U.S. economic outlook if you pardon the pun. After all, central bankers, as well as popular market narratives have often gotten inflation wrong in recent years. Remember how rising prices in the aftermath of Covid-19 were supposed to be transitory?
Headline Consumer Price Index (CPI) inflation for June was reported at 3.0% year-over-year, following a straight downward trend from its cyclical heights of 9.1% year-over-year in June 2022. Lower price gains for food and especially base effects that lead to energy price deflation were the main drivers, which makes one wonder why it should have been considered all that remarkable by many market participants. Core CPI inflation rates, by contrast, which exclude food and energy prices and tend to paint a clearer picture of underlying trends, declined as well but by a much lesser extent. For June, core inflation was reported at 4.8% year-over-year, “only” down from its cyclical heights of 6.6% year-over-year in September 2022. For the Fed, core inflation is of higher importance than headline readings, which also can be quite fickle from one month to the next. After all, it is the job of a central back to react on persistent inflationary pressures, rather than, ahem, transitory factors. Needless to say, the Fed’s preferred measure remains the core personal consumption expenditure (PCE) price inflation - a separate inflation gauge which differs with respect to component weights from the CPI. But since the CPI is released earlier in the month and some financial securities are linked to it, markets track its development very closely. The most significant driver for core inflation, looking at weights and price pressures, are prices for shelter (roughly 35% of overall CPI). Until a few months ago, market participants and economists puzzled whether prices for shelter would behave as their leading indicators suggested. Chart 1 indicates that shelter prices indeed seem to follow the prices for rents and houses with a lag of about 12 months, though the relationship does not appear all that stable. Also, keep in mind that a lot of the leading indicators, especially for household rents, have not been around for all that long.
Chart 1: House price indices and rents indicate shelter inflation look set to normalize over time
*Consumer Price Index for All Urban Consumers (CPI-U)
**The FHFA HPI is a weighted, repeat-sales index, meaning that it measures average price changes in repeat sales or refinancings on the same properties.
*The S&P CoreLogic Case-Shiller Home Price Indices are the leading measures of U.S. residential real estate prices, tracking changes in the value of residential real estate nationally.
****The Zillow Observed Rent Index (ZORI) measures changes in asking rents over time, controlling for changes in the quality of the available rental stock.
Sources: Haver Analytics, DWS Investment GmbH as of 7/24/23
After the initial impact of higher policy rates, activity in the housing market recently seemed to pick up again. This indicates that the sector starts to digest higher interest rates and fosters expectations of a bottoming out of house price declines. If this development turns out to be persistent, there would be some downside potential for shelter prices in inflation for the next 12 months, but it seems to be fairly limited thereafter. We should keep in mind that shelter inflation has a historical long-run average of around about 3.3% year-over-year which could imply that we need a normalization of other components of inflation as well to eventually reach the Fed’s target of 2%.
Ongoing deflation in durable goods prices (roughly 12.5% of overall inflation) in the past six months supported the overall normalization of inflation as well. The main drivers therein have fallen under used cars prices. Chart 2 indicates that we can expect further cooling prices in this segment as well in the short run.
Chart 2: Used car prices decline after years of pushing inflation
Sources: Haver Analytics, DWS Investment GmbH as of 7/24/23
That mainly leaves the so-called services ex. shelter component. This component is habitually seen as closely linked to the development of wages. And indeed, a quick check reveals that since the onset of the pandemic, service wage development account for most of the variation in service ex. shelter prices: roughly 45% of service price variation (ex. shelter) can be explained by the evolution of service wages, while before the pandemic the explanatory power was substantially lower. The fate of the labor market therefore remains crucial for the outlook on (service ex. shelter) inflation.
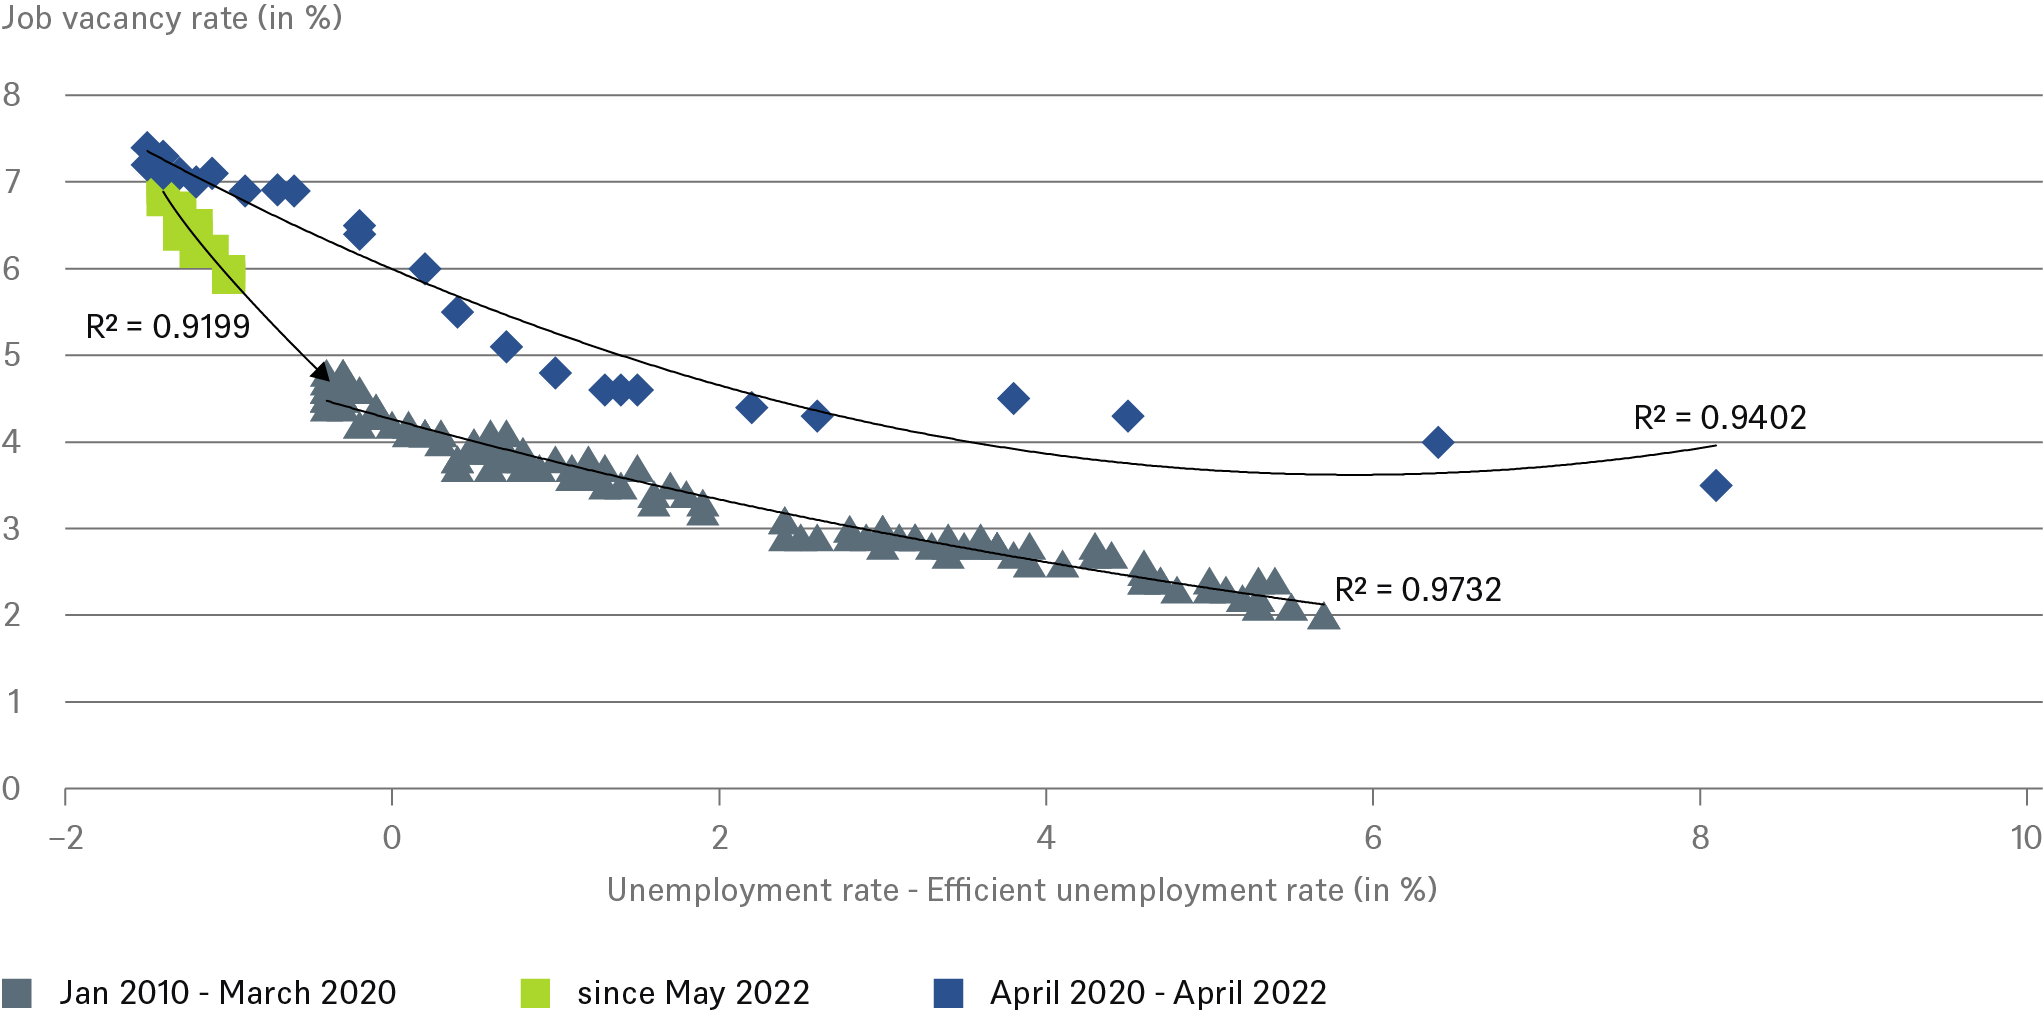
The demand vs. supply imbalance on the overall labor market still seems to be in place as the so-called modified Beveridge Curve suggests (Chart 3).
Chart 3 Labor market tightness: modified Beveridge Curve
 Sources: Haver Analytics, DWS Investment GmbH as of 7/24/23
In its original form, the Beveridge Curve relates job vacancies (vertical axis) with the unemployment rate (horizontal axis). We like to make a slight adjustment to the concept by substituting the absolute level of unemployment with the current labor market tightness (that is the unemployment rate minus the so-called efficient unemployment rate[1]). The modified curve suggests that the abnormal relationship during pandemic (blue diamonds) might be over, and it seems like the labor market is slowly converging back to its pre-pandemic dynamics (grey triangles). The path of this convergence is depicted by the blue trendline and exhibits a remarkable robustness. Should this trend prevail further, the implication would be that the job vacancy rate must go down further, by around about 2%, to fully eliminate the supply demand imbalance on the labor market (e.g., we end up at zero on the horizontal axis). One reason for firms to lower labor demand in times when inflation is cooling might be the diminishing ability to pass through higher costs from higher wages. In this case, firms would need to correctly anticipate the higher cost burden and bring labor supply and demand into equilibrium through a “perfectly” managed reduction of labor demand. Our model suggests an unemployment rate of 4% when this state is achieved.
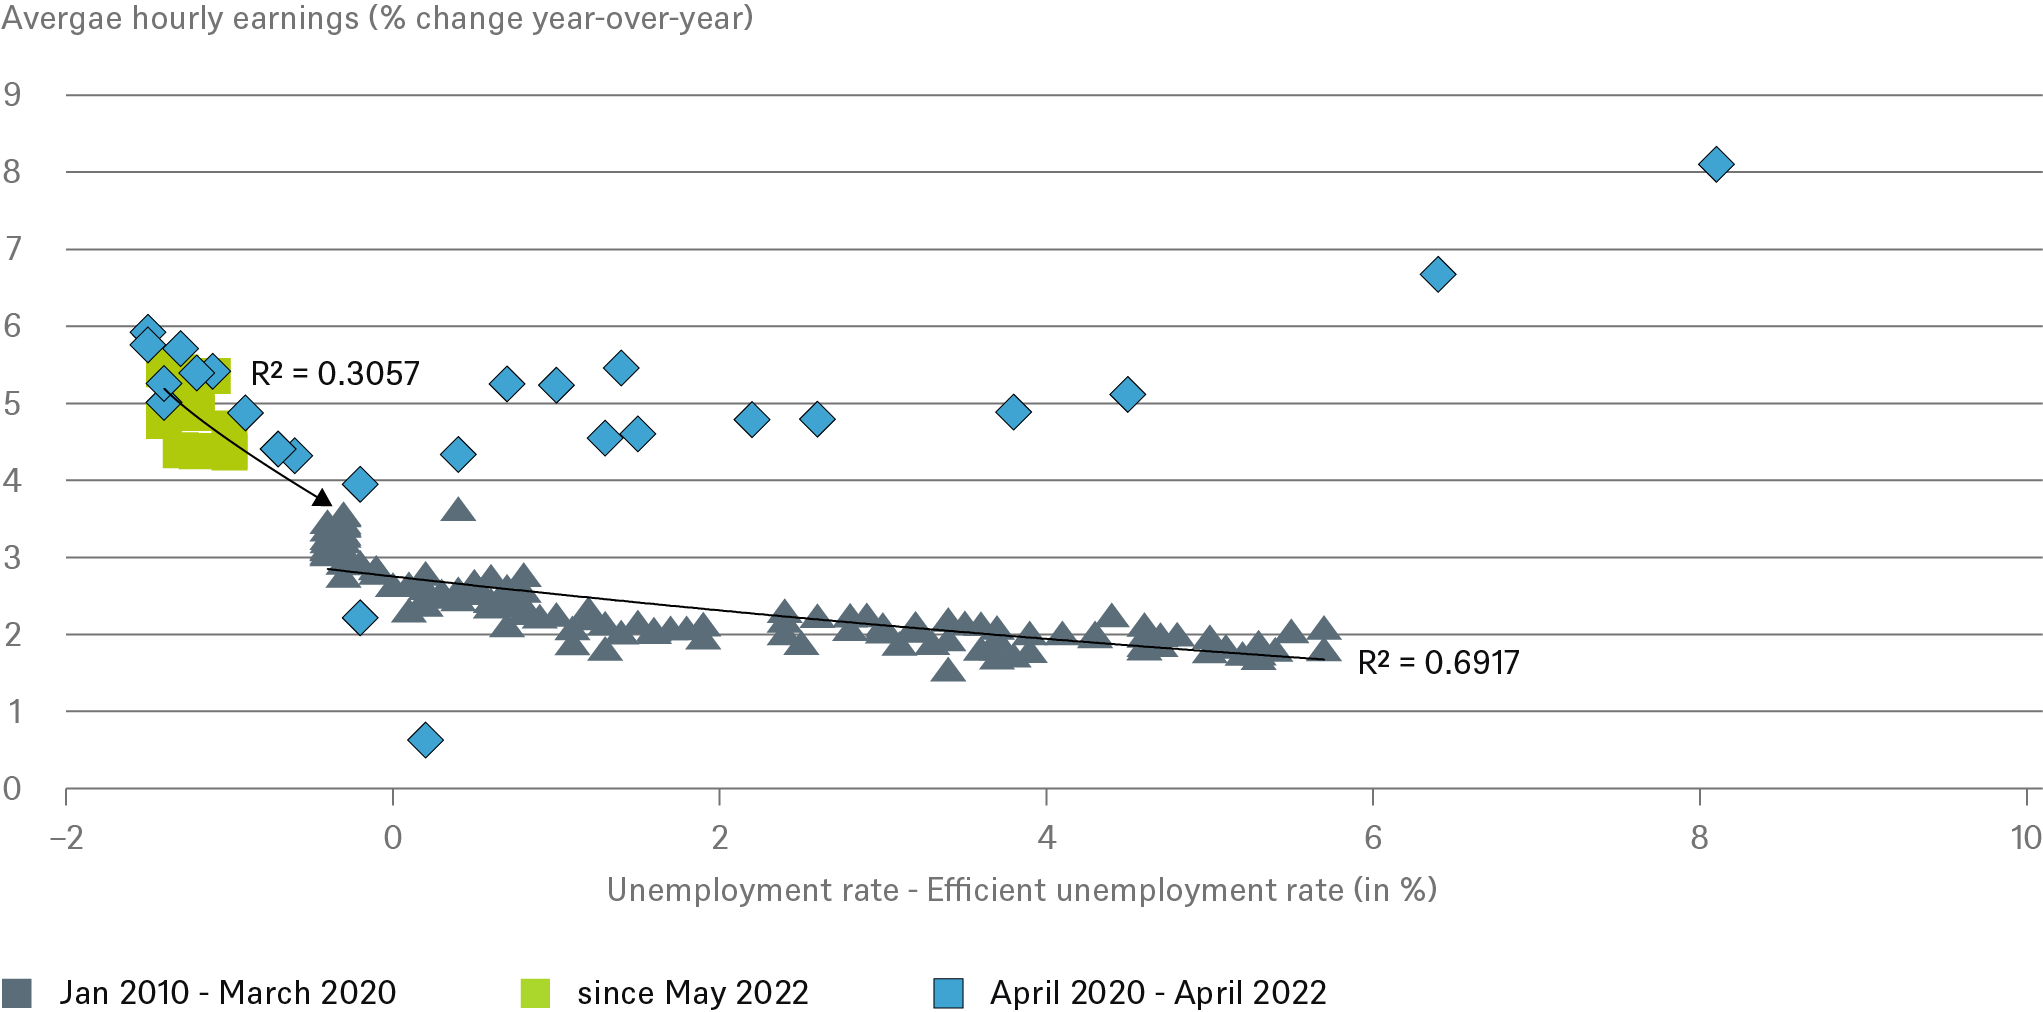
Unfortunately, the above analysis is not so straight forward when we try to determine the equilibrium growth rate of wages. While exploring the behavioral micro-foundations of real-world dynamics after inflationary outbursts is beyond the scope of this note, even just looking at the statistical relationship between labor market tightness and overall average hourly wage growth within the above framework suggests the need for caution. Even leaving the pandemic data aside, the relationship has lately exhibited insufficient stability which in turn increases the uncertainty of what wage growth should be expected once supply equals demand (Chart 4).
Chart 4: Wage dynamics compared to labor market tightness
 Sources: Haver Analytics, DWS Investment GmbH as of 7/24/23
Despite this uncertainty, our main takeaway would be that wage growth may tend to remain somewhat above pre-pandemic trends in the near future, even as labor demand is cooling down. This situation, if it materializes, could act as a surprise and might be the reason why the unemployment rate should overshoot its equilibrium value of 4% somewhat: firms might not only step away from higher labor demand but also have to shrink their workforce somewhat to lower costs. We believe this adjustment most likely will be limited as firms know about the shortfalls of labor supply and might rather want to hold on to an experienced workforce rather than replace it later at high costs. The consequence, however, is that firms aggregate profits now might get under pressure from another angle: the buildup of labor market slack could impact consumption negatively.
That said, up recently, it has seemed that the U.S. consumer continued to benefit from a few factors that support the willingness to spend money. The main argument of optimists for much of the past years have been leftover excess savings from the pandemic. While recent research by the Fed[2] indicates that those excess savings are largely gone, we would like to point to the fact that distributional effects could overstate the firepower of the absolute level of deposits left (see our recent Chart of the week[3]). An increasing willingness to take up (expensive) consumer loans supports this view. Another tailwind for consumption, which emerges right now, is increasing real incomes as inflation trends lower (which, of course, might be mirrored by lower corporate profits). While this will likely support consumption ahead (households relying on wages tend to have a higher marginal propensity to consume than richer ones relying on dividends and capital gains), we at the same time observe a pick-up in the savings rate from its lows in mid-2022. This can be interpreted as the re-building of reserves as some households may already be anticipating less favorable conditions on the labor market – a process that seems very likely following our analysis.
With inflation on the right track and consumers still in good shape, we think the odds for a soft landing have risen but are not yet high enough to make it a base case. For the time being, we still expect a mild recession later in the year, mild enough to not derail the Fed from its higher for longer narrative. Central bankers have made it clear: they do not want inflation to win the fight and are ready to err on the hawkish side. And this is the point where good news becomes bad news. Any path to a soft landing of the economy, which implies more than expected robustness in consumption, also increases the risk of the Fed rising rates even further. This in turn increases the risk of a more severe recession than the one we have in mind.
Overview: key economic indicators
|
2023 |
2024 |
|||||||
|
Q1 |
Q2F** |
Q3F** |
Q4F** |
Q1F** |
Q2F** |
Q3F** |
Q4F** |
|
|
GDP (% qoq, annualized) |
2.0 |
0.9 |
-1.8 |
-1.2 |
1.6 |
1.6 |
2.0 |
1.6 |
|
Core inflation (% yoy)* |
4.6 |
3.8 |
3.4 |
3.2 |
2.8 |
2.4 |
2.4 |
2.4 |
|
Headline inflation (% yoy)* |
4.2 |
3.7 |
3.3 |
3.1 |
2.8 |
2.5 |
2.3 |
2.3 |
|
Unemployment rate (%) |
3.5 |
3.7 |
3.8 |
4.1 |
4.2 |
4.3 |
4.4 |
4.5 |
|
Fiscal balance (% of GDP) |
-4.6 |
-4.8 |
||||||
|
Federal funds rate (%) |
4.75 - 5 |
5 - 5.25 |
5.25 - 5.5 |
5.25 - 5.5 |
5.25 - 5.5 |
4.75 - 5 |
4.25 - 4.5 |
4 - 4.25 |
*PCE Price Index
** Forecast
Source: DWS Investment GmbH as of 7/24/23
Forecasts are not a reliable indicator of future returns. Forecasts are based on assumptions, estimates, views and hypothetical models or analyses, which might prove inaccurate or incorrect.


