- Home »
- Insights »
- CIO View »
- Investment Traffic Lights »
- Investment Traffic Lights

- August has been one of the weakest months of the year so far with various asset classes posting negative returns.
- While China’s economy and policy measures dominated headlines, it is still the U.S. economy and central banks that set the tone globally.
- Our short-term outlook is slightly cautious as we believe that markets are overconfident about an economic soft landing. Some reality checks are due.
1 / Market overview
1.1 China attracting most headlines, but investors focus on U.S. inflation and growth
A mixed month overall, with a bias on disappointment. But why should investors fare better in August than holidaymakers? The little spurt in the last week of the month reduced the losses somewhat, but otherwise it was the first down month for U.S. equities since February[1] and bonds also lost ground, again.
On the political side, it was a quieter month, which may have helped to push China into the spotlight, and with negative headlines. Ongoing payment difficulties at Chinese property developers were echoed by troubles in the $3 trillion shadow banking system.[2] Economic data continued to fall short of expectations and inflation slipped into negative territory. Added to this were further concrete economic sanctions by the Biden administration[3] to curb China’s technological ambitions, even as high-level diplomatic exchanges between the two countries gained momentum. By contrast, little emerged from the widely anticipated meeting of the BRICS countries in South Africa. The extent to which China and India are still at odds with each other is evident in the rumor that Xi Jinping does not want to appear at the G20 meeting in India. More positive news from China included a large number of measures intended to help the real estate market, along with minor interest rate cuts. But this has not yet made much of an impression on the capital markets, even though expectations of China could hardly fall lower at the moment. We analyze the most pressing challenges for the country and why we are not quite so pessimistic about the economic prospects in our latest China note.[4]
However, the summer showed once again that although it is the world's second largest economy, China’s influence on capital markets often remains limited. The U.S. sets the tone and is less dependent on events in the rest of the world due to its much lower dependence on exports compared to Europe, for example. Instead, it is dependent on its huge domestic economy and, for more than two-thirds of GDP, consumption. And here, Americans have not disappointed, proving more willing to spend than expected, which is probably one of the reasons why the consensus estimates for third quarter GDP have been revised upwards from 0.9% to 2.1% since mid-June. However, we do not expect this momentum to be sustained until the end of the year.
1.2 Still solid performance year-to-date
Market events in August were once again dominated by the questions of how long the Fed must and will remain restrictive, and whether the U.S. economy could manage to get through this aggressive cycle of interest rate hikes with only a slight slowdown. In inflation, meanwhile, there was a significant and welcome slowdown, with the headline CPI rising just 3.2% from a year ago in July, but core inflation remained uncomfortable, at 4.7%, and U.S. 10-year Treasury yields climbed to 4.34% in August, their highest level since 2007.
This does not bode well for homeowners. Interest rates on 30-year mortgages stood at 7.5% at the end of August. A year ago the figure was 6%, two years ago just 3%. U.S. nominal yields are driven by real yields, which are being propelled upwards by the better-than-expected economic momentum in the U.S. so far, and possibly concern that the government's enormous budget deficits (which were one of the reasons for Fitch's downgrading U.S. of government debt from AAA to AA+ this summer) could face much more restrained demand in the future, especially from abroad. Further likely factors are that interest rate cuts are now seen as being more distant and the Fed intends to make a further reduction in its balance sheet of USD 1.5 trillion by mid-2025. U.S. technology stocks, however, have recently taken all this in their dynamic stride. Though five months of strong outperformance by growth stocks over value stocks since the beginning of the year were followed by three more even months, end-August saw growth stocks flexing their high-tech muscles again.
Among the few gainers in August was the U.S. dollar,[5] although it has continued to trade in a fairly narrow band since the beginning of the year. Oil also rose slightly in the month thanks to a late-month jump. Globally almost all stock indices lost – in Europe and the U.S. by about 2-3% but in China by almost double digits, while Hong Kong’s Hang Seng lost more than 8%. But even after a red August, most are still well up on the year. And in the past week the scenario of only a slight economic slowdown coupled with declining inflation and robust labor markets (call it Goldilocks or a soft landing) regained traction as, on the one hand, 2-year Treasury yields fell by about 20 basis points while the Nasdaq 100 gained almost 5%. Year-to-date the Nasdaq 100 is up more than 40%, while the S&P 500 is up 17%, and the Euro Stoxx 50 is up 13%. UK stocks, on the other hand, haven’t done too well this year, as the price return of the FTSE 100 has been negative.
2 / Outlook and changes
We will keep the outlook a little shorter in this edition, as the quarterly revision of the 12-month forecasts is due shortly. The basic scenario of a slight economic downturn followed by a slight upswing remains, although we believe that U.S. growth will form a trough a little later than previously expected – maybe at the turn of the year. Our concern about more volatile markets in the second half of the year remains. The market may have priced in a fairly optimistic scenario for the U.S. by now but may have become too pessimistic about China's medium-term outlook.
2.1 Fixed Income
Sovereign yields did not move much in August and we expect them to continue to do so for the time being, which may open up short-term trading opportunities. Data dependence remains the central banks’ mantra. Currently we are Neutral on both U.S. and German 10-year bonds. But soft labor data in the U.S. showed that higher rates might be starting to have an impact on the economy and there is a risk that inflation might accelerate again in September. This combined with high Treasury issuance and hawkish Fed talk might mean that yields could retest their recent higher ranges. In Europe we remain positive on Italian and Spanish spreads, although we believe that markets might start to view Italy more critically should it fail to secure NextGen EU-funds in time.
IG credit and HY credit:
We continue to prefer Investment Grade (IG) over High Yield (HY) as IG asset class inflows continue to be positive and primary issuance should prove manageable for the remainder of 2023. HY spreads have moved sideways in the absence of any meaningful catalysts for prices. Activity in August calmed down notably, with market liquidity quite limited. We remain neutral, however, as supportive factors are fading and corporate news has been mixed.
Emerging Markets:
We remain cautious on EM sovereigns altogether, although we are witnessing more discrimination within the asset class. Since early summer, bonds of issuers facing financial or operational problems (many of which related to certain sectors in China) have seen their spreads widening compared to better quality paper. In general, EM credit spreads have resumed their gradual tightening trend since early June, helped by muted primary supply. Continuing disinflationary trends and a sense that interest rates are approaching their peak for the Fed and other major economies have further lifted bond prices. But this means a lot of the good news is already priced in.
Currencies:
We have recently reduced our positive stance on the euro versus the U.S. dollar to neutral. We have the impression that the outlook of one more potential rate hike in Europe and none in the U.S. had been fully priced in. The dollar’s current strength is probably based on better recent economic growth dynamics versus Europe, a faster increase in real rates in the U.S. and weakening emerging market currencies which increase demand for the dollar. We continue to be neutral on other currencies.
2.2 Equities
We will provide a full update on our sectoral and regional preferences in the next Traffic Lights, with fresh input from our quarterly strategic meeting. From a general perspective, we enter the final four months of the year with some caution, given that some parts of the equity market have become quite expensive, especially compared to Fixed Income. The equity risk premium for the U.S. market has dropped to a 20-year low. Weak earnings growth, high real interest rates and stretched valuations in some areas make equity markets look vulnerable. There is a big disconnect between the relative performance of cyclical versus defensive stocks and leading indicators such as the purchasing managers indices. Therefore, we reiterate our defensive vs. cyclical stance. We are Neutral on global financial stocks but keep with our Overweight in European financials. Banks are benefitting from higher central bank rates and a potential normalization of the yield curve. In addition, valuations are not demanding, which ties in well with our value stance. There is also little sign of deteriorating loan quality, which is encouraging. We are Overweight on Communication Services. Telecoms have improved their pricing power and their Capex needs are easing. We have upgraded Consumer Discretionary to outperform as we look ahead though the likely soft period for the economy. As healthy labor markets are keeping consumers well-funded, luxury, sport fashion, car and e-commerce spending is strong. We remain skeptical, however, about the listed real estate sector – it keeps underperforming the wider market on a global basis, though some regions are better than others.
U.S.
We remain cautious on U.S. equities relative to global equities. The current price/earnings-ratio of above 20 is not consistent with our base case scenario of modest earnings per share (EPS) growth in 2023 and 2024 and continuing high real U.S. yields. Our view that stocks are facing stiff competition from other asset classes remains unchanged.
Europe
We stick to our Overweight on European equities. Europe remains attractively priced, although early indicators have clouded somewhat recently. Nonetheless Europe is still achieving decent earnings momentum and trades at reasonable valuations.
Japan
We remain Neutral on Japan. While many tailwinds persist, we fear that as inflation is at multi-decade highs, potential tightening by the Bank of Japan (BoJ) is an increasing tail-risk at current valuations.
Emerging Markets
We are Neutral on Emerging Markets. Economic growth is fading and is expected to be too shallow to boost commodity-sensitive EMs. In addition, Chinese growth and stimulus measures may continue to disappoint. On the other hand, sentiment on China turned so sour over the summer that even a marginally positive news flow might be enough to maintain the recovery that began in late August.
2.3 Alternatives
Real Estate
Higher interest rates have filtered into real estate valuations, causing prices to drop 10%-20% globally; yet, fundamentals are generally stalwart, evidenced in tight vacancies and rising rents. E-commerce growth, coupled with efforts to bolster supply chains, is driving demand for warehouses. Chronic housing shortages also persist across most major European, Asian, and U.S. cities. We believe that the outlook is positive for the next 12 months and that commercial real estate has largely priced in today’s interest rates. Rent growth may slacken as economies slow, but any leasing pullback should be mild, and tighter financing should curb construction, paving the way for fundamentals to re-tighten next year as economies gather momentum.
Gold
As the Chinese economy remains challenged, investors have shown little demand for base metal. Both offshore and onshore traders have been staying put as market waits for the Chinese government to produce a more comprehensive economic stimulus plan. High real yields on U.S. debt have generated a strong bid for the U.S. dollar, putting further pressure on gold prices. However, gold has been very resilient so far, staying above the 1,900 USD/oz floor. We expect the gold price to trade in a tight range until the September Fed meeting.
Oil
With global demand steady and OPEC+ controlling supply, crude prices have posted an impressive run. As long as general risk appetite remains strong and OPEC+ continues to provide support by limiting supply, crude should continue to trade higher. Even with potential strikes (e.g. Australia), global natural gas should remain well supplied.
3 / Past performance of major financial assets
Total return of major financial assets year-to-date and past month
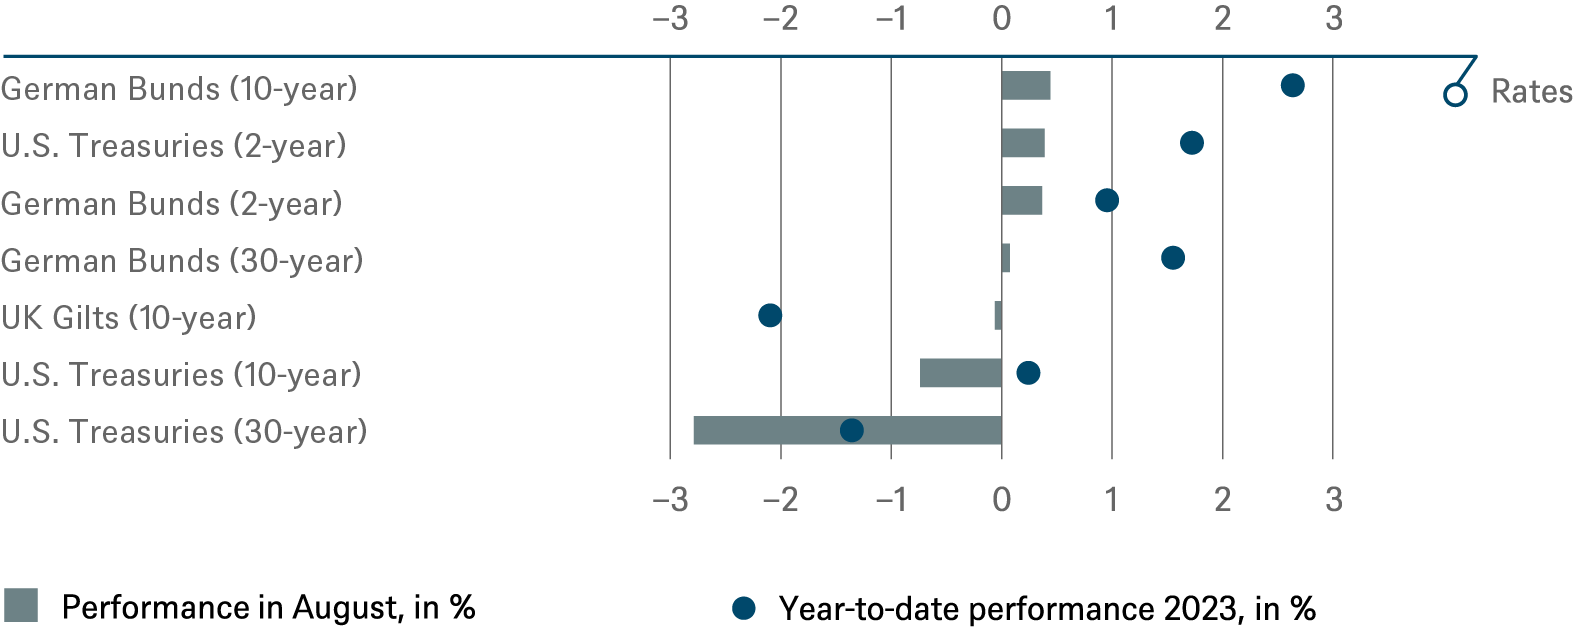
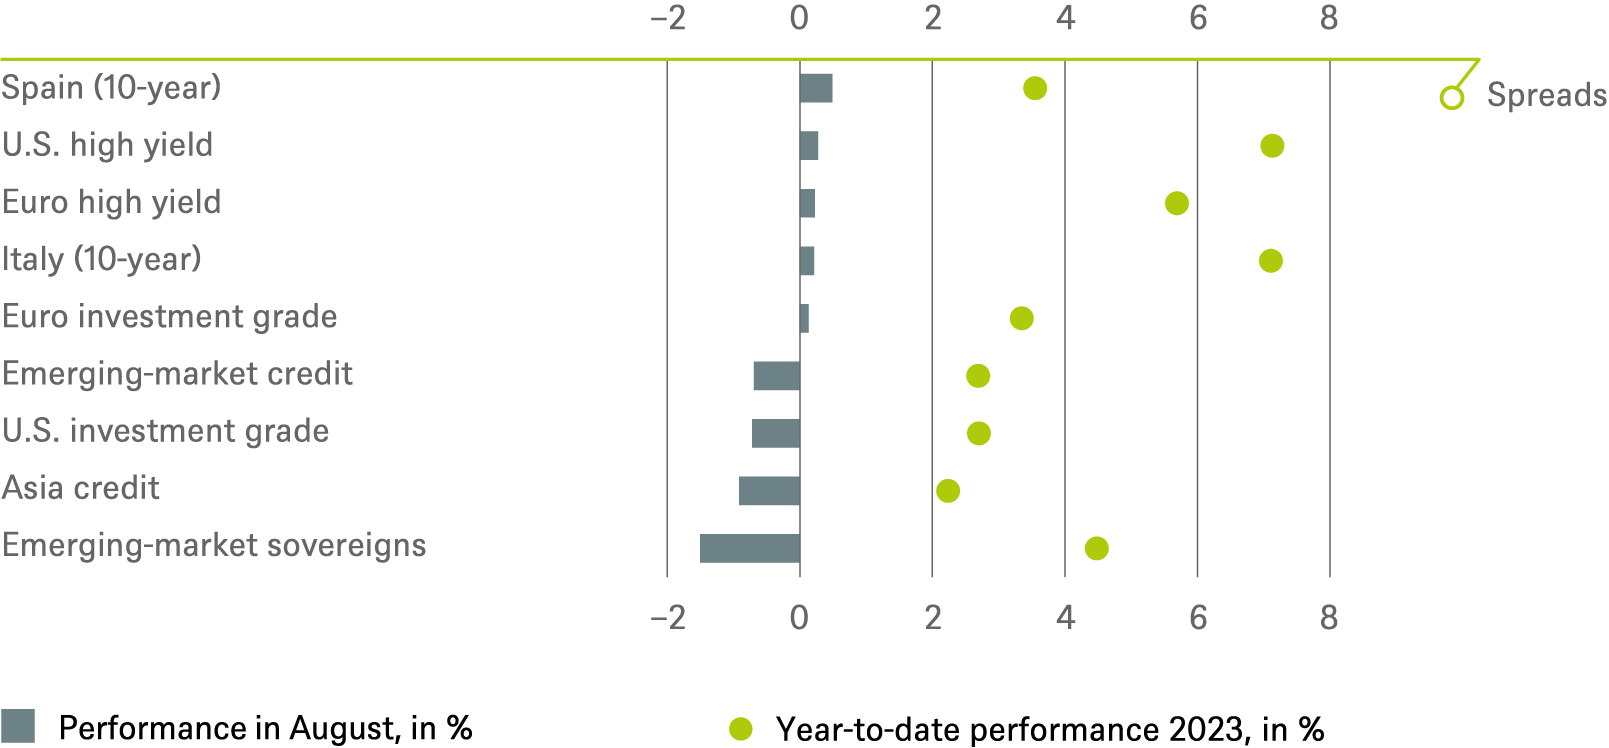
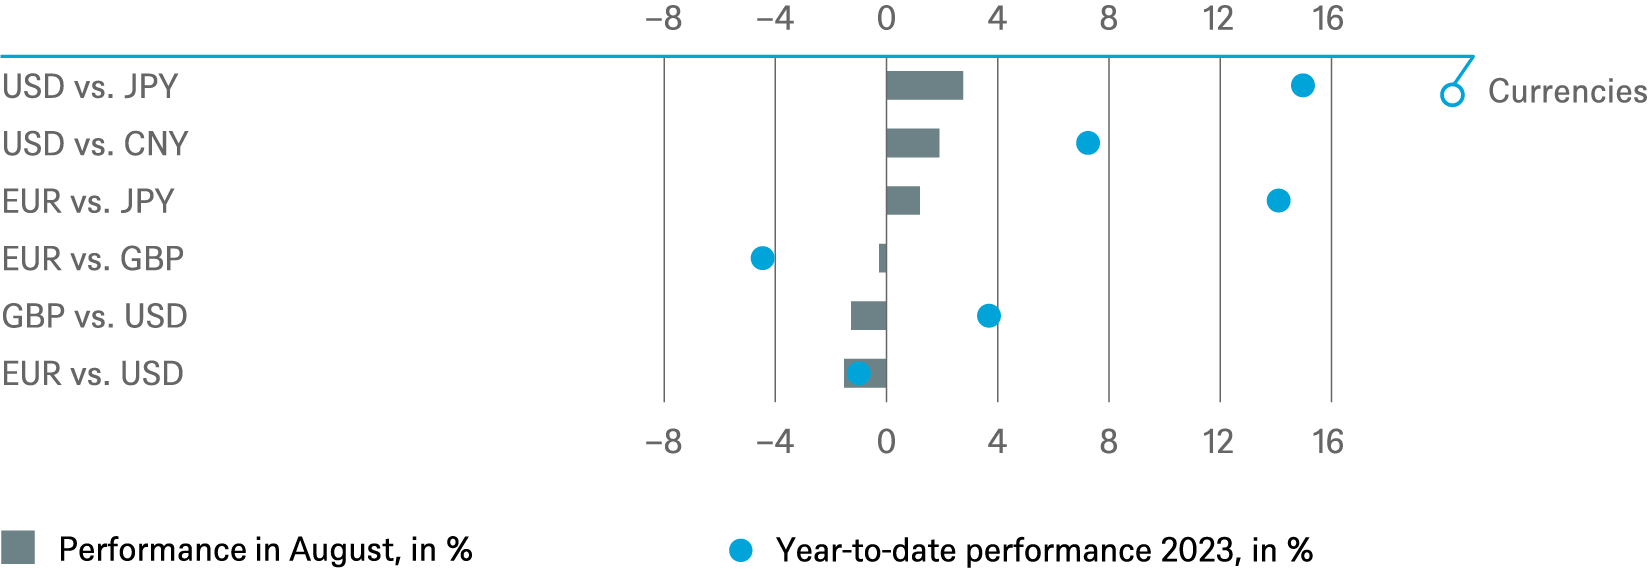
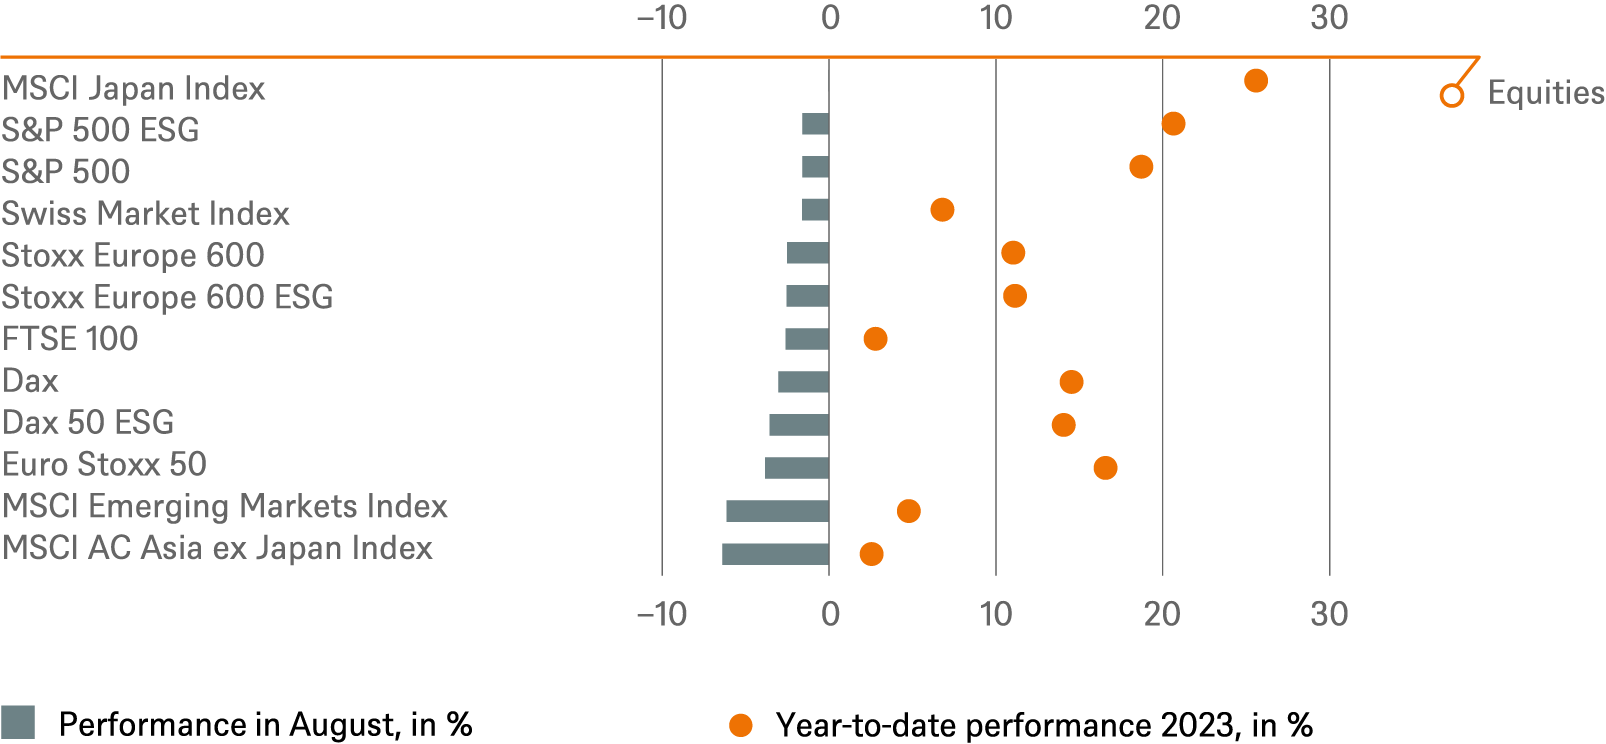
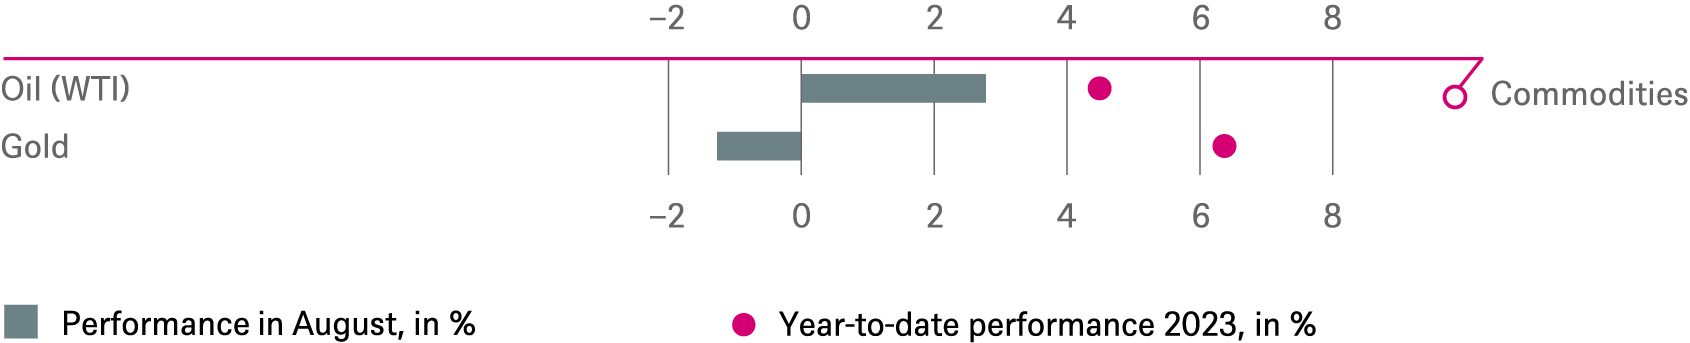
Past performance is not indicative of future returns.
Sources: Bloomberg Finance L.P., DWS Investment GmbH as of 8/31/23
4 / Tactical and strategic signals
The following exhibit depicts our short-term and long-term positioning.
4.1 Fixed Income
Rates |
1 to 3 months |
until June 2024 |
|---|---|---|
| U.S. Treasuries (2-year) | ||
| U.S. Treasuries (10-year) | ||
| U.S. Treasuries (30-year) | ||
| German Bunds (2-year) | ||
| German Bunds (10-year) | ||
| German Bunds (30-year) | ||
| UK Gilts (10-year) | ||
| Japanese government bonds (2-year) | ||
| Japanese government bonds (10-year) |
Spreads |
1 to 3 months |
until June 2024 |
|---|---|---|
| Spain (10-year)[6] | ||
| Italy (10-year)[6] | ||
| U.S. investment grade | ||
| U.S. high yield | ||
| Euro investment grade[6] | ||
| Euro high yield[6] | ||
| Asia credit | ||
| Emerging-market credit | ||
| Emerging-market sovereigns |
Securitized / specialties |
1 to 3 months |
until June 2024 |
|---|---|---|
| Covered bonds[6] | ||
| U.S. municipal bonds | ||
| U.S. mortgage-backed securities |
Currencies |
1 to 3 months |
until June 2024 |
|---|---|---|
| EUR vs. USD | ||
| USD vs. JPY | ||
| EUR vs. JPY | ||
| EUR vs. GBP | ||
| GBP vs. USD | ||
| USD vs. CNY |
4.2 Equity
Regions |
1 to 3 months[7] |
until June 2024 |
|---|---|---|
| United States[8] | ||
| Europe[9] | ||
| Eurozone[10] | ||
| Germany[11] | ||
| Switzerland[12] | ||
| United Kingdom (UK)[13] | ||
| Emerging markets[14] | ||
| Asia ex Japan[15] | ||
| Japan[16] |
Style |
1 to 3 months |
|
|---|---|---|
| U.S. small caps[27] | ||
| European small caps[28] |
4.3 Alternatives
1 to 3 months[29] |
until June 2024 |
|
| Commodities[30] | ||
| Oil (WTI) | ||
| Gold | ||
| Infrastructure (listed) | | |
| Infrastructure (non-listed) | ||
| Real estate (listed) | ||
| Real estate (non-listed) APAC[31] | ||
| Real estate (non-listed) Europe[31] | ||
| Real estate (non-listed) United States[31] |
4.4 Legend
Tactical view (1 to 3 months)
The focus of our tactical view for fixed income is on trends in bond prices.Positive view
Neutral view
Negative view
Strategic view until June 2024
- The focus of our strategic view for sovereign bonds is on bond prices.
- For corporates, securitized/specialties and emerging-market bonds in U.S. dollars, the signals depict the option-adjusted spread over U.S. Treasuries. For bonds denominated in euros, the illustration depicts the spread in comparison with German Bunds. Both spread and sovereign-bond-yield trends influence the bond value. For investors seeking to profit only from spread trends, a hedge against changing interest rates may be a consideration.
- The colors illustrate the return opportunities for long-only investors.
Limited return opportunity as well as downside risk
Negative return potential for long-only investors


