
Crude oil posted losses in September. During the first week of the month, oil prices declined sharply as overproduction concerns returned to the forefront, with demand expected to slow after the summer driving season. Prices broke below the 40 dollars per barrel support level during the second week of September. Even though the OPEC technical committee had revised down their demand expectations, OPEC and Russian oil ministers chose to maintain existing production quotas during the most recent Joint-Ministerial Monitoring Committee meeting. The ministers also decided to extend the deadline for member nations to come into compliance until December. Meanwhile, despite a rebuke from other UN Security Council members, the United States decided to reinstate UN sanctions on Iran despite its withdrawal from the Joint Comprehensive Plan of Action (JCPOA), commonly known as the Iran nuclear deal, in 2018.[1] The immediate impact of this is not clear, nor is it apparent whether the other parties to the original JCPOA agreement will honor the UN sanctions proposed by the United States. Oil-price volatility flared once again towards the end of September amidst continuing concern about global economic recovery.
In the near term, our negative view on oil demand will likely persist as recovery from Covid-19 has slowed since the initial re-opening of economies in the summer – and in the United States and Europe new lockdown measures are now being implemented. While we do not expect to see a repeat of the strict national lockdowns experienced during the first wave, we believe these measures will affect consumer demand and ultimately the price of oil. Another concern for the oil price is that OPEC might increase production in January. Nearer-term, the U.S. elections are a big question mark hanging over oil and other markets and are very likely to cause further volatility. Positive upside, on the other hand, could come from any new fiscal-stimulus package in the United States. An agreement prior to the elections now looks unlikely, but it could be a tailwind for oil prices post-election. For now, we take a neutral view and remain on the sidelines.
We expect investor interest in gold to remain strong, with central banks continuing to affirm "lower for longer" interest-rate policies globally. With the U.S. Federal Reserve (Fed) moving toward an average rate target and signaling a willingness to tolerate inflation above its 2% target for some time, we would expect investors to continue to add gold to their portfolios to hedge against possible sharp rises in inflation. We therefore believe gold will continue to draw support from the accommodative fiscal and monetary environment in place across the globe. While there may well be periods of consolidation and heightened price volatility, we believe the yellow metal’s upward price trend remains intact and expect a price of 2,100 dollars per ounce by September 2021. In particular during the potential election turmoil, we believe that gold remains an attractive diversifier. We also expect silver to continue to catch a bid as a cheaper alternative to gold. Platinum prices should continue to be well supported in the near term as the Covid-19 pandemic has curtailed a significant amount of production from South Africa, which accounts for 75% of global supply.
While gold showed signs of weakness in September, agricultural commodities continued their strong run, led once again by grains. The two most important ones, corn and soybeans, continued to benefit from strong Chinese demand. Grain prices continued to grind higher leading into what was ultimately a bullish United States Department of Agriculture (USDA) World Aggregate Supply and Demand report. The USDA cut production estimates for corn and soybeans, following a less-than-ideal finish to summer production.
Coffee prices had performed very strongly as inventories were drawn down to five-year lows, but elevated local prices have incentivized a considerable supply response in Brazil, and these stocks are beginning to be certified and delivered to the exchange. In response, coffee prices tumbled over 14%.
Global importers, including China, will need to turn to the United States for corn and soybeans until at least January, pointing to strong export demand regardless of currency fluctuations. We expect continued volatility in grains as importers continue to make purchases opportunistically. There is a crowded net-long speculative position in corn and soy. Further sales to China are needed to fuel this demand-driven rally higher. On the other hand, a pullback in prices will likely be met with strong export sales. We therefore expect some volatility going forward. Meanwhile we expect softs, such as coffee, cocoa and sugar, to face further weakness, especially if the Brazilian Real continues to slide lower.
Lingering concerns over African Swine Flu in Germany should help provide some support for lean-hog prices in the near term. However, we expect volatility to persist, driven by uncertainty surrounding the demand outlook for beef and pork. The sustainability of the global recovery and the fulfillment of purchase commitments from China will continue to have important implications for livestock.
Past 30-day and year-to-date performance of major commodity classes
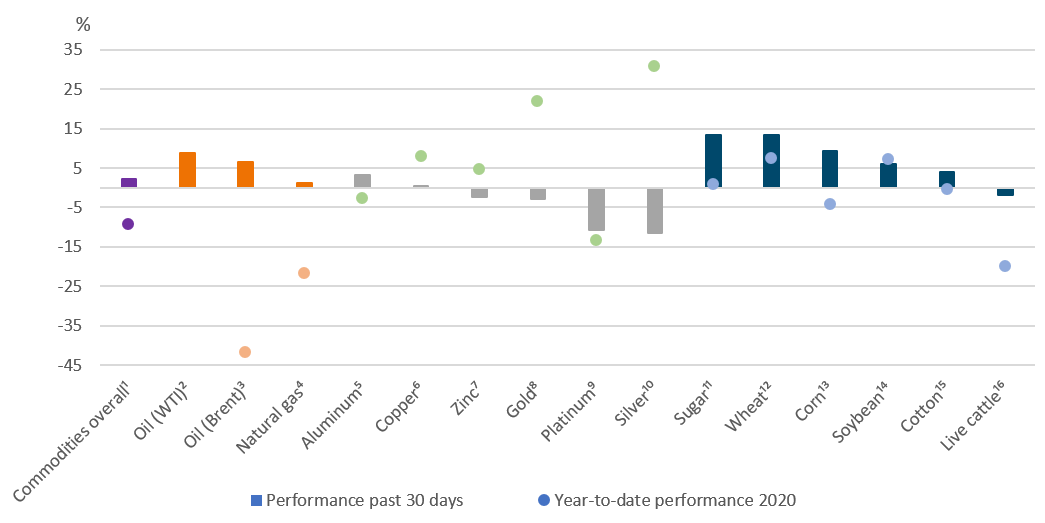
Past performance is not indicative of future returns.
Sources: Bloomberg Finance L.P., DWS Investment Management Americas Inc. as of 10/15/20
¹ Bloomberg Commodity Index, ² Bloomberg WTI Crude Oil Subindex, ³ Bloomberg Brent Crude Subindex, ⁴ Bloomberg Natural Gas Subindex, ⁵ Bloomberg Aluminum Subindex, ⁶ Bloomberg Copper Subindex, ⁷ Bloomberg Zinc Subindex, ⁸ Bloomberg Gold Subindex, ⁹ Bloomberg Platinum Subindex, ¹⁰ Bloomberg Silver Subindex , ¹¹ Bloomberg Sugar Subindex , ¹² Bloomberg Wheat Subindex, ¹³ Bloomberg Corn Subindex, ¹⁴ Bloomberg Soybeans Subindex, ¹⁵ Bloomberg Cotton Subindex, ¹⁶ Bloomberg Live Cattle Subindex
Appendix: Performance over the past 5 years (12-month periods)
|
|
09/15 - 09/16 |
09/16 - 09/17 |
09/17 - 09/18 |
09/18 - 09/19 |
09/19 - 09/20 |
|
Bloomberg Commodity Index |
-2.8% |
-1.0% |
0.9% |
-8.7% |
-8.9% |
|
Bloomberg WTI Crude Oil Subindex |
-23.7% |
-3.6% |
45.1% |
-27.9% |
-52.9% |
|
Bloomberg Brent Crude Subindex |
-14.5% |
2.3% |
52.5% |
-25.4% |
-33.9% |
|
Bloomberg Natural Gas Subindex |
-26.6% |
-16.3% |
-13.4% |
-25.9% |
-41.2% |
|
Bloomberg Gold Subindex |
17.0% |
-4.1% |
-9.2% |
19.7% |
24.5% |
|
Bloomberg Silver Subindex |
30.3% |
-15.2% |
-14.0% |
11.7% |
32.7% |
|
Bloomberg Platinum Subindex |
13.0% |
-12.8% |
-11.9% |
5.2% |
-0.2% |
|
Bloomberg Copper Subindex |
-7.2% |
30.1% |
-8.1% |
-9.4% |
14.6% |
|
Bloomberg Aluminum Subindex |
2.5% |
22.2% |
-1.3% |
-20.2% |
-3.4% |
|
Bloomberg Zinc Subindex |
37.5% |
30.8% |
-14.8% |
-3.1% |
-0.6% |
|
Bloomberg Corn Subindex |
-20.2% |
-6.7% |
-12.9% |
-2.9% |
-12.2% |
|
Bloomberg Wheat Subindex |
-29.1% |
-7.9% |
-4.1% |
-7.1% |
12.2% |
|
Bloomberg Soybeans Subindex |
6.4% |
-3.2% |
-18.2% |
-2.2% |
5.6% |
|
Bloomberg Sugar Subindex |
70.8% |
-41.7% |
-27.5% |
1.0% |
1.9% |
|
Bloomberg Cotton Subindex |
11.9% |
0.1% |
12.5% |
-23.3% |
4.6% |
|
Bloomberg Live Cattle Subindex |
-17.2% |
23.2% |
-0.1% |
-7.8% |
-10.6% |
Past performance is not indicative of future returns.
Sources: Bloomberg Finance L.P., DWS Investment GmbH as of 10/19/20.


