
The oil rally continues. On the supply side, OPEC and Russia reached an agreement to extend the June production cap into July instead of implementing the planned scaling down of cuts. This is perhaps a sign that the major producers are conscious of the oil market's fragility despite the recent rise in oil prices. Large inventory overhangs support that fear. On the demand side, the re-opening of economies across the globe has brought significant optimism, even though the amount of realized demand that has emerged give little support for it.
The oil-price surge is consistent with overall strong market sentiment on the economic recovery. Recent data showing a small fall in U.S. unemployment has further boosted the recovery sentiment. However, we are cautious about the oil price after this rapid recovery. We expect supply to increase from OPEC and Russia in August. Some U.S. producers have also announced that production has resumed, thanks to the recovery in the oil price. We also expect the recovery in demand in countries outside China to be more gradual than current prices imply. Without an improvement in supply-and-demand balances the oil-price rally looks unsustainable. Strategically, OPEC+ and other oil producing nations’ actions to remove excess production should help to alleviate the global inventory glut. This, however, is a gradual process, therefore we expect June 2021 future prices for West Texas Intermediate (WTI) to be 43 dollars per barrel.
In contrast to oil, we believe the rally in metals is supported by solid fundamentals. Strong fiscal stimulus in China has and continues to support the infrastructure sector, and China's effort to increase the local government loan limit has certainly bolstered metal prices. Similarly, the United States and governments across Europe are talking extensively about increasing fiscal spending.
While copper demand has been hit hard by the pandemic, it has benefitted from these recent developments and therefore inventories have not risen substantially. China's infrastructure and construction plans in particular appear to support a copper price of 6,060 dollars per ton by end-June 2021, a close to 4% increase on the current level. We share a similarly positive outlook for iron ore. Supply disruptions, with production slow to resume after Covid-19-related suspensions, shipping issues and strong rainfall in Brazil, coupled with solid demand, support this view. For other base metals, we are still cautious. We believe actual construction projects will likely roll out gradually and so demand growth in base metals may be slower than the current restocking activity seems to imply.
Gold, on the other hand, has given back a little of its recent gains, reflecting risk-on sentiment in markets. But we blieve it remains well supported, at over 1,700 dollars per ounce, holding up well in its two-month range. A weaker U.S. dollar, low real interest rates and higher inflation expectations are likely to support gold prices. Particularly important for gold is the widespread belief that the Eurozone and Japan are likely to retain negative interest rates for a long time to come. Additionally, the U.S. Federal Reserve (Fed) has agreed to extend the low rate regime into 2022. And the list of geopolitical risks is increasing, further supporting our constructive outlook for gold, with a forecast of 1,830 dollars per ounce by end-June 2021.
As for oil, so for sugar: we are not as optimistic about sugar or corn prices. Both commodities are set for high levels of production this year and increased demand for ethanol does create further demand for sugar and corn, but we view current prices as too bullish.
We reaffirm our belief that China will meet the requirements of its phase-one trade agreement with the United States. China has been consistently purchasing U.S. grains as the prices are very attractive relative to Brazil. We consider this to be supportive for prices of grains and livestock in the second half of the year. We expect U.S. grains in the coming planting seasons to be well bid.
Past 30-day and year-to-date performance of major commodity classes
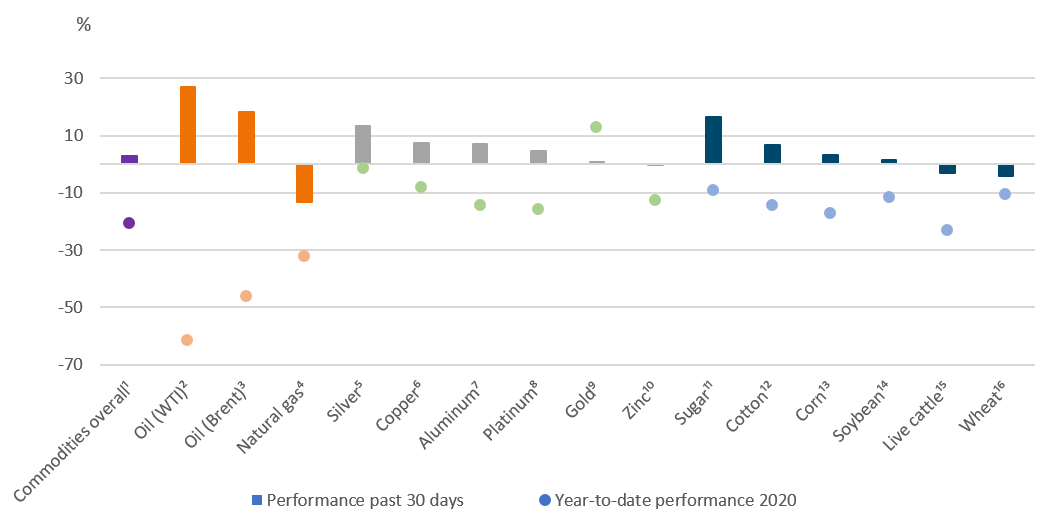
Past performance is not indicative of future returns.
Sources: Bloomberg Finance L.P., DWS Investment Management Americas Inc. as of 6/11/20.
1Bloomberg Commodity Index, 2Bloomberg WTI Crude Oil Subindex, 3Bloomberg Brent Crude Subindex, 4Bloomberg Natural Gas Subindex, 5Bloomberg Silver Subindex, 6Bloomberg Copper Subindex, 7Bloomberg Aluminum Subindex, 8Bloomberg Platinum Subindex, 9Bloomberg Gold Subindex, 10Bloomberg Zinc Subindex, 11Bloomberg Sugar Subindex, 12Bloomberg Cotton Subindex, 13Bloomberg Corn Subindex, 14Bloomberg Soybeans Subindex, 15Bloomberg Live Cattle Subindex, 16Bloomberg Wheat Subindex
Appendix: Performance over the past 5 years (12-month periods)
|
|
05/15 - 05/16 |
05/16 - 05/17 |
05/17 - 05/18 |
05/18 - 05/19 |
05/19 - 05/20 |
|
Bloomberg Commodity Index |
-15.5% |
-2.9% |
9.5% |
-14.3% |
-18.2% |
|
Bloomberg WTI Crude Oil Subindex |
-41.5% |
-15.0% |
36.7% |
-20.2% |
-56.6% |
|
Bloomberg Brent Crude Subindex |
-37.2% |
-10.2% |
55.6% |
-18.7% |
-39.4% |
|
Bloomberg Natural Gas Subindex |
-41.2% |
0.2% |
-19.9% |
-18.0% |
-47.5% |
|
Bloomberg Gold Subindex |
1.7% |
3.0% |
0.1% |
-2.3% |
30.2% |
|
Bloomberg Silver Subindex |
-5.5% |
6.3% |
-7.7% |
-14.3% |
22.6% |
|
Bloomberg Platinum Subindex |
-12.1% |
-4.2% |
-5.9% |
-14.7% |
7.7% |
|
Bloomberg Copper Subindex |
-24.3% |
20.3% |
15.2% |
-16.0% |
-9.6% |
|
Bloomberg Aluminum Subindex |
-15.0% |
21.1% |
17.6% |
-23.9% |
-18.0% |
|
Bloomberg Zinc Subindex |
-14.4% |
32.6% |
19.7% |
-12.7% |
-20.5% |
|
Bloomberg Corn Subindex |
4.9% |
-17.3% |
-7.6% |
-5.4% |
-30.4% |
|
Bloomberg Wheat Subindex |
-7.6% |
-22.1% |
1.3% |
-13.7% |
1.1% |
|
Bloomberg Soybeans Subindex |
16.2% |
-17.0% |
5.7% |
-20.6% |
-12.0% |
|
Bloomberg Sugar Subindex |
29.7% |
-17.7% |
-18.3% |
-13.6% |
-17.8% |
|
Bloomberg Cotton Subindex |
-2.1% |
14.7% |
24.6% |
-28.7% |
-18.2% |
|
Bloomberg Live Cattle Subindex |
-17.9% |
15.3% |
-16.2% |
-1.0% |
-13.7% |
Past performance is not indicative of future returns.
Sources: Bloomberg Finance L.P., DWS Investment GmbH as of 6/12/20.


