- Home »
- Insights »
- Blog »
- Authors »
- Jason Chen »
- Currency Hedging: how has it worked and how might it work going forward?

Despite a selloff from mid-February into early April, global equity markets (as measured by the MSCI All Country World Unhedged Index) generated very strong returns of 22.3% in 2025. Strong global equity returns were bolstered by a robust international equity market with the MSCI Europe, Australasia, and Far East (“EAFE”) Index returning 31.2% on a currency unhedged basis, driven by a combination of both strong equity returns as well as strengthening in many of the EAFE constituent currencies relative to the US Dollar. In this blog, we take a more strategic view, reviewing how MSCI EAFE equities for USD-denominated investors have fared over the past decade and how hedging currency risk (reducing the impact of fluctuations in currency exchange rates on international equity returns) could have impacted the risk and return experience. Equally, or perhaps more importantly, we will take an opportunity to revisit the currency hedging framework and evaluate currency hedging decisions through an objective lens, focusing on the risks involved and how hedging can affect returns through interest rate differentials between currencies, commonly known as currency carry.
Historical performance
Looking at empirical performance over the past decade (see Figure 1), we can observe that the MSCI EAFE Currency Hedged Index has returned 177% on a cumulative basis (or about 10.7% annualized) versus MSCI EAFE Currency Unhedged Index return of 120%, or about 8.2% per annum over the past decade.
Figure 1: Cumulative total returns (12/31/2015 to 12/31/2025)
Source: Bloomberg as of 12/31/2025. Past performance is not indicative of future results. It is not possible to invest directly in an index.
This outperformance can be attributed to 2 main factors: 1. Relative strength of the US Dollar over the past decade (although this has effectively completely reversed in 2025) and 2. Attractive levels of currency carry generated by hedging currency risk. Over the 10-year period ending December 31, 2025, the MSCI EAFE Currency Index, which represents the spot prices (the current market value of a currency) of the currency exposure of the MSCI EAFE Index, has appreciated around 1.7% (see Figure 2) following the strong per-formance of EAFE currencies in 2025. Over the same time frame, primarily due to higher US interest rates, hedging EAFE equity cur-rency exposure back into US Dollars provided a tailwind of currency carry for investors as shown in Figure 3.
Figure 2: MSCI EAFE Currency index spot return (12/31/2015 to 12/31/2025)
Source: Bloomberg as of 12/31/2025. Past performance is not indicative of future results. It is not possible to invest directly in an index.
*MSCI EAFE Currency index represents the value of major international currencies represented within the MSCI EAFE equity index.
Figure 3: MSCI EAFE Currency Hedged Index Annualized Implied Carry using Foreign Exchange (“FX”) Forwards (12/31/2015 to 12/31/2025)
*Green diamonds represent implied carry (discounted future prices from interest rate differentials) in the 1, 2, and 3-year fx forward prices.
Source: Bloomberg, MSCI, DWS Calculations as of 12/31/2025. Past performance is not indicative of future results. It is not possible to invest directly in an index.
The impact of currency risk on returns becomes more apparent when comparing the return contribution of the respective compo-nents to MSCI EAFE Currency Hedged vs Currency Unhedged returns. Whereas MSCI EAFE Unhedged has experienced volatility from the currency component of risk and return (represented by the dark gray bars), the impact of currencies on MSCI EAFE Hedged returns was much more gradual, and as a result of the positive currency carry, was a positive contributor to returns over the past decade as shown in Figure 4.
Figure 4: Comparison between MSCI EAFE Unhedged and Hedged of contribution to cumulative return (12/31/2015 to 12/31/2025)
Source: Bloomberg, DWS Calculations as of 12/31/2025. Past performance is not indicative of future results. It is not possible to invest directly in an index
*Interaction/Residual refers to the impact of combined effect of the interaction between local equity return and the fx return.
Over the same time frame, annualized volatility has been about 11.7% for MSCI EAFE Currency Hedged versus about 14.7% annualized volatility for MSCI EAFE Currency Unhedged. The rolling 1 year volatility (i.e. the fluctuation in returns for international equities with and without currency risk) is shown in Figure 5.
Figure 5: Rolling 1-year volatility (12/31/2015 to 12/31/2025)
Source: Bloomberg, DWS Calculations as of 12/31/2025. Past performance is not indicative of future results. It is not possible to invest directly in an index.
These historical results show 2.5% annual outperformance from currency hedging while realizing roughly 3.0% lower volatility. It is worth noting that these strong currency hedged returns did, however, rely on certain conditions (as previously mentioned, the benefit of currency carry (based on higher US interest rates relative to interest rates in other developed economies) and, to a lesser extent, the early strength of the US Dollar). Combining these higher empirical returns and lower empirical volatility, we can compare the Sharpe ratios (the ratio of excess return over the risk-free interest rate to the volatility or fluctuation) of the MSCI EAFE Currency Hedged and MSCI EAFE Currency Unhedged indices shown in Figure 6.
Figure 6: Annualized Return statistics (12/31/2015 to 12/31/2025)
| MSCI EAFE Currency Hedged | MSCI EAFE Currency Unhedged | |
|---|---|---|
| Return (geometric) | 10.72% | 8.18% |
| Return (arithmetic) | 10.91% | 8.98% |
| Volatility | 11.68% | 14.72% |
| Sharpe | 0.75 | 0.46 |
| Downside Deviation | 8.60% | 9.78% |
| Sortino | 1.02 | 0.70 |
| Up Capture Ratio | 80% | 100.00% |
| Down Capture Ratio | 57% | 100.00% |
Source: Bloomberg, DWS Calculations as of 12/31/2025. Past performance is not indicative of future results. It is not possible to invest directly in an index.
*Calculations using monthly frequency
Looking forward, investors can approach currency hedging decisions by utilizing this objective currency hedging framework. As a reminder, this currency hedging framework consists of 4 components:
- Currency spot return
- Currency carry
- Volatility of local equity and currency
- Correlation between local equity and currency
Currency spot return
Forecasting currency spot returns (the change in currency price) is admittedly a challenging endeavor. Long-run currency forecasting is equally difficult. Measures such as purchasing power parity or interest rate parity rely, in part, on unchanging macroeconomic and monetary conditions which may or may not play out as expected. In the shorter term, uncertainty remains over the strength of the economy recovery as well as the reaction function of global central banks to economy acceleration and any inflationary pressures.
What we can observe from history is that long term spot returns, in some cases, were relatively small despite significantly volatility at times. For example, the Euro, as shown in Figure 7, since its inception on January 1, 1999, has returned -0.5%, which equates to -2 basis points of spot return per annum. Given no spot return after two and a half decades, taking on currency risk has not been histori-cally justified by any spot return, either positive or negative.
Figure 7: Euro historical spot price versus the US Dollar (1/1/1999 to 12/31/2025)
Source: Bloomberg as of 12/31/2025. Past performance is not indicative of future results. It is not possible to invest directly in an index.
Looking at the US Dollar Index (DXY) over a longer time frame, the story remains the same: Since DXY’s inception in 1967, the spot return on the US Dollar index equates to around -2 basis points (“bps”) per annum over the past nearly 6 decades (see Figure 8).
Figure 8: US Dollar Index historical spot price (1/31/1967 to 12/31/2025)
Source: Bloomberg as of 12/31/2025. Past performance is not indicative of future results. It is not possible to invest directly in an index.
*US Dollar Index (DXY) tracks the general value of the US Dollar relative to a basket of foreign currencies.
Currency carry
As previously mentioned, due to higher interest rates in the US as compared to international developed countries, currency carry (the return from interest rate differences between countries) has been a significant tailwind for currency hedging over the past decade. As interest rates diverged significantly in 2022, these differentials continued to favor US investors who hedged international developed currency exposure back to US Dollars for the next few years. While these interest rate differentials are expected to narrow, Figure 9 shows that currency carry implied in the fx forward market (where investors can lock in an exchange rate for future transactions) and still appears quite positive over the intermediate term.
Figure 9: MSCI EAFE US Dollar Hedged Index Annualized Implied Carry using FX Forwards (12/31/2015 to 12/31/2025)
*Green diamonds represent implied carry (discounted future prices from interest rate differentials) in the 1, 2, and 3-year fx forward prices.
Source: Bloomberg, MSCI, DWS Calculations as of 12/31/2025. Past performance is not indicative of future results. It is not possible to invest directly in an index.
Focusing on volatility
While the strength of the US Dollar and the benefits of US Dollar carry appear to have been strong tailwinds for currency hedging over the past decade, these two drivers of relative returns can be subject to changing market environments. Risk as measured by volatility and drawdowns, we would argue, are more structural arguments for hedging currency risk for EAFE equity exposures.
Over the long-term, currency unhedged EAFE equities have realized significantly higher volatility relative to local markets. Figure 10 shows that looking at 5-year periods since 1969 (the index inception date) the MSCI EAFE Currency Unhedged Index has realized higher volatility than the MSCI EAFE Local Index in more than 93% of these 5-year rolling windows (on average, 2.6% less volatile per year).
Figure 10: Differential between unhedged and local volatility in 5-year increments (12/31/1969 to 12/31/2025)
Source: Bloomberg, DWS Calculations as of 12/31/2025. Past performance is not indicative of future results. It is not possible to invest directly in an index.
Looking at rolling 1-year volatility over the past decade, there is an observed difference in the volatility between MSCI EAFE Currency Hedged and MSCI EAFE Currency Unhedged, namely that the unhedged index has been more volatile over most periods of time (99% of observations) as shown in Figure 11.
Figure 11: Differential between rolling 1-year volatility of MSCI EAFE hedged and unhedged (12/31/2015 to 12/31/2025)
Source: Bloomberg, DWS Calculations as of 12/31/2025. Past performance is not indicative of future results. It is not possible to invest directly in an index.
This has translated directly into more severe average drawdowns (losses of value) for MSCI EAFE Currency Unhedged as shown in Figure 12.
Figure 12. Max Drawdowns of MSCI EAFE Hedged and Unhedged (12/31/2015 to 12/31/2025)
Source: Bloomberg, DWS Calculations as of 12/31/2025. Past performance is not indicative of future results. It is not possible to invest directly in an index.
*Represents the maximum decline in returns during a market downturn before recovering.
Broken down into calendar years, we can also observe the severity of drawdowns between EAFE Currency hedged and EAFE Currency unhedged returns (see Figure 13).
Figure 13. Max Drawdowns by Calendar Year (12/31/2015 to 12/31/2025)
| Max drawdown by calendar year | |||
|---|---|---|---|
| MSCI EAFE Currency Hedged | MSCI EAFE Currency Unhedged | Difference | |
| 2016 | -15.37% | -12.95% | -2.41% |
| 2017 | -2.63% | -2.05% | -0.58% |
| 2018 | -13.99% | -20.93% | 6.93% |
| 2019 | -6.31% | -7.59% | 1.28% |
| 2020 | -30.06% | -33.90% | 3.84% |
| 2021 | -5.05% | -7.15% | 2.10% |
| 2022 | -14.51% | -28.59% | 14.08% |
| 2023 | -6.15% | -11.13% | 4.98% |
| 2024 | -11.01% | -10.58% | -0.43% |
| 2025 | -14.68% | -14.36% | -0.32% |
Source: Bloomberg, DWS Calculations as of 12/31/2025. Past performance is not indicative of future results. It is not possible to invest directly in an index.
By leveraging this currency hedging framework, we can demonstrate that this higher level of realized risk is not purely coincidental. It is, in fact, attributable to the fact that unhedged international investments are implicitly levered. Said otherwise, a US investor choos-ing to purchase $100 unhedged EAFE equities is long both $100 of local EAFE equities and $100 of EAFE currency. Because of this EAFE currency exposure, the necessary conditions for investors to prefer being unhedged (or assuming this $100 of currency expo-sure) purely from the standpoint of risk, or volatility, are demonstrably narrow.
In simple terms, the volatility of an unhedged EAFE investor consists of 3 components: 1. The volatility of the local equity market, 2. The volatility of the basket of currency exposure, and 3. The correlation between the returns of the local equity and the currency. If we combine these components into a formula, we can determine at which level of correlation investors would be indifferent between the volatility of currency hedged EAFE versus currency unhedged EAFE (i.e. the point where currency risk no longer increases overall investment volatility). We refer to this equation as the “Correlation Breakeven” as shown in Figure 14.
Figure 14. Correlation breakeven equation
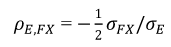
Source: DWS
In simplified terms, the correlation between the local equity market and the currency must be less than negative one-half of the ratio of the currency volatility to the local equity volatility. Perhaps the most important part of this equation is that this correlation breake-ven must always be negative. In other words, the correlations between equities and currencies must be negative (and in some cases significantly negative) to justify not hedging the currency risk purely as it relates specifically to risk or volatility reduction (although this does not account for the potential positive or negative returns from the currency).
Volatility of local equity and currency
The 2 components of this equation are the 2 risks that a currency unhedged investor will own. As mentioned previously, an investor who buys $100 of MSCI EAFE is first buying $100 of EAFE currencies and then taking that $100 of EAFE currencies and using it to buy $100 of EAFE local equities. By doing so, the investor is owning $100 of each of the 2 below components in their singular investment. Figure 15 shows the rolling 1-year volatilities (how much prices fluctuated for international stocks with and without currency risk) of the two component risks of an unhedged EAFE equity exposure: local equity and local currency.
Figure 15. Rolling 1-year volatility (12/31/2015 to 12/31/2025)
Source: Bloomberg, DWS Calculations as of 12/31/2025. Past performance is not indicative of future results. It is not possible to invest directly in an index.
Because this investment consists of 2 distinct risks, the way these risks interact will help determine to what extent the currency risk will add volatility to the investment. Using the correlation breakeven equation, we can demonstrate that, over the past decade, this correlation break-even level has hovered around -0.28 (shown in Figure 16), which has been far lower than the realized correlation between the returns of the local equity and currency indices.
Figure 16. Rolling 1-year correlation breakeven vs actual correlation (12/31/2015 to 12/31/2025)
Source: Bloomberg, DWS Calculations as of 12/31/2025. Past performance is not indicative of future results. It is not possible to invest directly in an index.
Conclusion
Over the past decade, currency hedging EAFE equity exposure added tremendous benefit to investors through both increased realized returns (excess return over MSCI EAFE Currency Unhedged of 2.5% per annum) and reduction of realized annualized volatility by about 3.0%. Looking ahead, on the return side of the equation, predicting the direction of currency markets has proven historically challeng-ing, although currency carry (the advantage of higher interest rates in the US relative to other countries) appears to continue to sup-port the case for currency hedging (based on the fx forward curve). Alternatively, the risk argument for currency hedging is structural in nature and has not historically been beholden to changing market conditions. The calculus of owning an implicitly levered portfolio of equity and currency risk resulted in higher levels of volatility, and by extension, more severe market drawdowns, for EAFE investors who choose not to hedge their currency risk.