- Home »
- Insights »
- Global CIO View »
- U.S. Economic Outlook

- Odds of a soft landing have increased but lots of imbalances still linger.
- On top of uncertainties about inflationary dynamics and labor market conditions, we highlight measurement issues from various economic statistics to corporate profits.
- We still have reasonable doubts that the necessary adjustments can be smooth and expect what we call a soft recession.
We must admit that the odds of a soft landing have increased. Our definition of a soft landing is that the U.S. Federal reserve’s (the Fed’s) tightening can reduce inflation without creating excessive unemployment while economic growth remains well below potential but still above zero. Recent studies of past cycles in which the Fed has fought inflation puts the empirical odds of a soft landing at about 50/50.[1] These are rough odds, as one can often debate how exactly to assess many of these past cycles. However, we still think that on balance, the unique factors of the current cycle (pandemic supply disruptions, massive fiscal spending, energy price shocks) more likely than not look set to work against central bankers. We therefore remain cautious given the headwinds currently building for the consumer.
The health of consumers and the depth of their pockets remains one of the most important factors in achieving a soft landing. There are many estimates of how much of the so-called excess savings from the generous pandemic payments are left. The bottom line is, no one can say for sure. Some argue that the excess savings are already gone, while other estimates are not quite as bleak.[2] Given all the methodological challenges and uncertainties, we expect that excess savings will most likely be exhausted in the third quarter of this year. The ultimate consequence of the depletion of excess savings is that consumers will have to rely more and more on their income and other sources of financing to continue to spend. This view is supported by the Federal Reserve's findings in the September Beige Book: “Some Districts highlighted reports suggesting consumers may have exhausted their savings and are relying more on borrowing to support spending.”[3] And indeed, U.S. consumers - most likely in line with the runoff of their fiscally stimulated excess savings - have built up levels of consumer credit to where pre-pandemic trends suggest they should be today (see Chart 1).
Chart 1: A history of debt – consumer have caught up with pre-pandemic trends for outstanding loans rather quickly.
Sources: Federal Reserve Board, Haver Analytics as of 9/19/2023
Borrowing itself is not a cause for concern as long as household balance sheets remain strong. And indeed, the good news is that the household debt-to-GDP ratio remains relatively low at around 73% - at least compared to levels of the past 20 years. As intended by the Fed, higher interest payments (due to higher policy rates) limit the ability to borrow further. That, in turn, limits spending on goods and services. The usual way to look at this trade-off is to compare non-mortgage interest payments as a fraction of disposable income (that is, after-tax income), as shown in Chart 2.
Chart 2: Personal interest payments as % disposable income
Sources: U.S. Bureau of Economic Analysis, Haver Analytics as of 9/19/2023
Together with the increased use of consumer credit and higher interest rates set by the Fed, the share of disposable income spent on non-mortgage interest payments looks quite elevated by historical standards. While this still seems manageable - and we do not expect households to run into financial trouble - another statistic may shed some light on what is to come. Once interest payments are taken out of disposable income, households can either save the money leftover or spend it on goods and services. It is striking that the savings rate (as a percentage of disposable income) has remained low compared to pre-crisis levels, at only around 3.5-4.5% - levels that have only been lower in history before the Great Financial Crisis (GFC). In turn, the share of consumption as a percentage of disposable income literally exploded after the pandemic to levels (on average) of 93%, from around 88% in 2019. From this perspective, it is reasonable to assume that households may be inclined to consume less going forward - especially when the share of interest payments is likely to rise further as student loan repayments and interest come due again in October for tens of millions of borrowers.
As tailwinds such as excess savings fade and headwinds such as higher interest payments and student debt repayments increase, the importance of regular sources of income grows. Labor markets have remained solid so far but are beginning to show signs of fading momentum. While hiring was robust in August with 187,000 jobs created, a downward revision of 110,000 jobs over the past two months suggests less oomph than initially thought. Meanwhile, labor supply increased, with the labor force participation rate rising from 62.6% to 62.8%. More interestingly, more women in particular are joining the labor force, closing the gap in labor supply relative to pre-pandemic levels (see Chart 3).
Chart 3: Women closed the pre-pandemic participation gap while men still lag behind.
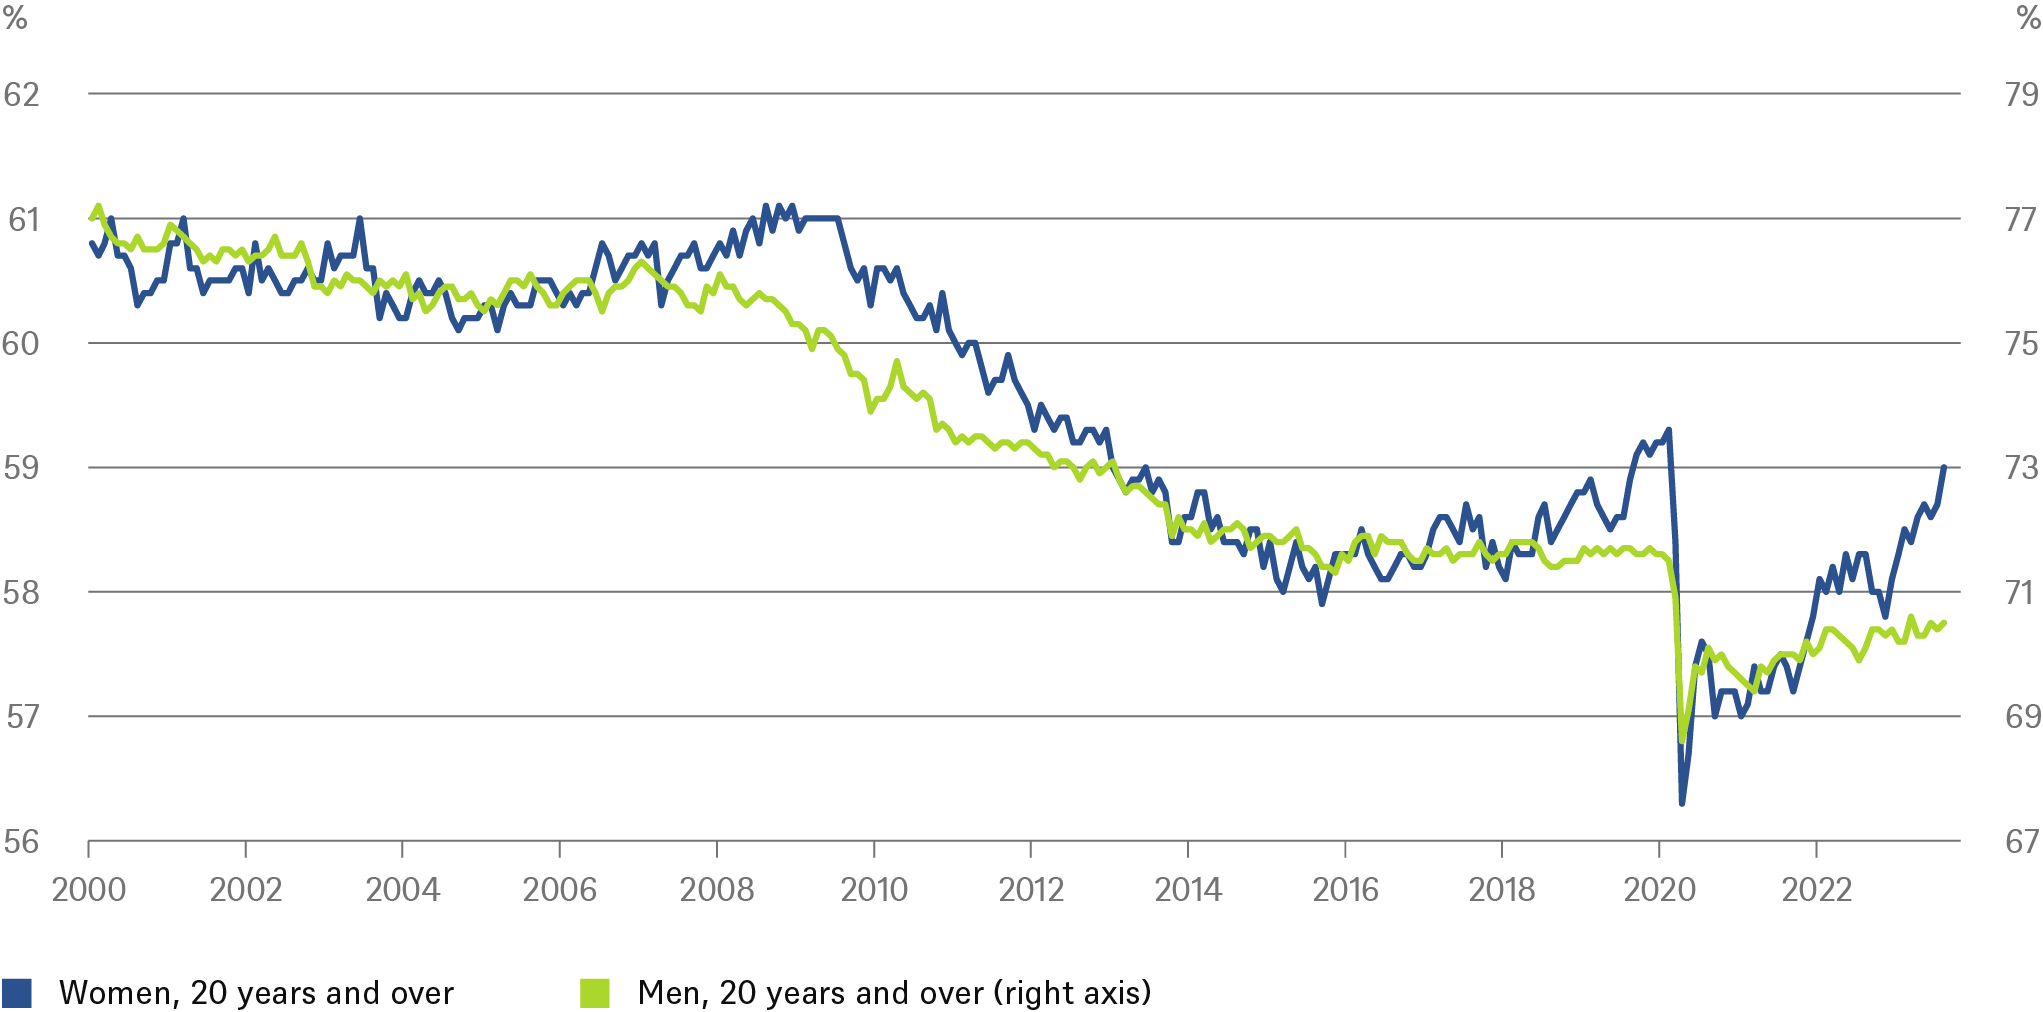
Sources: U.S. Bureau of Labor Statistics, Haver Analytics as of 9/19/2023
However, not all those who entered the labor force found their way back to work: the unemployment rate rose from 3.5% to 3.8%. With more supply meeting less demand, wage growth slowed: average hourly earnings rose "only" 0.2% month over month (m/m), down from 0.4% m/m in June and July. All in all, it appears that another former tailwind for consumers - higher wages in tight labor markets - is about to fade. The confluence of upcoming student loan repayments and the jump in the labor force participation rate may further limit the scope for renewed shopping sprees.
On consumption, the Fed’s Beige Book suggests that spending on “… tourism was stronger than expected, surging during what most contacts considered the last stage of pent-up demand for leisure travel from the pandemic era. But other retail spending continued to slow, especially on non-essential items.”[3] The latest retail sales report reflects this. While households are beginning to cope with higher prices at the pump, other categories such as non-store retail (e.g., online sales) were flat or decelerating in August, with a few exceptions. Since services consumption remains under-represented in the retail sales report, we will have to wait until we get the monthly personal consumption data to see what a potential reversal of the high-profile summer entertainment events might look like. Our best guess remains that consumption is likely to weaken.
Staying with higher energy prices. Consumer Price Index (CPI) inflation for August was pretty much in line with expectations, as headline inflation was boosted by rising energy prices back to 3.7% year over year y/y from 3.2% y/y, while core inflation cooled to 4.3% y/y from 4.7% y/y. While the Fed is unlikely to be too impressed by a higher headline series just yet, this reading still points to continued upside risks to inflation. A rule of thumb is that energy prices need to rise further or stay higher for longer before they show up in core inflation. Given that we may have seen the peak of wage bargaining amid rising labor supply, we remain constructive that core inflation can trend lower over time. And it seems that consumers agree with this assessment. Say what you like about the University of Michigan Consumer Sentiment Survey, but at least, it showed that consumers' inflation expectations declined somewhat in September. The short-term measure, which asks about inflation expectations over the next 12 months, fell from 3.5% to 3.1% - back to mid-2021 levels. The longer-term measure, which is of particular interest to central bankers, fell to 2.7% from 3.0%. Apart from that, other details of the report remain mixed. The current situation is seen as less plentiful (down to 69.8 from 75.7), and consumers seem to be somewhat less willing to spend.
Sentiment on the supply side remains mixed as well. The ISM Manufacturing Purchasing Managers’ Index (PMI) for August, after being weak throughout Q2, stabilized a bit at 47.6 from 46.4 as activity picked up, but this was most likely due to backlogs as new orders were weaker again at 46.8 from 47.3. The ISM Services PMI was strong again at 54.5 from 52.7, indicating continued momentum in the sector. However, inventories rose at a much faster pace than activity, putting the positive reading into some context. It appears that services firms are also working through backlogs, but are still supported by ongoing demand relative to current production. At least, that is suggested by the new orders component. Small business optimism, on the other hand, has been subdued for some time, as indicated by the National Federation of Independent Business (NFIB) small business optimism index (see the sectoral comparison in Chart 4).
Chart 4: Business sentiment across different sectors
Sources: National Federation of Independent Business (NFIB), Institute for Supply Management (ISM), Haver Analytics as of 9/19/2023
One explanation for the less optimistic sentiment among smaller firms is that they may struggle to adjust in a high inflation environment. Quite apart from issues of pricing power, simply dealing with hiring talent may present organizational challenges, even for those that could afford higher salaries, may be limited. While the ISM PMI surveys include companies of all sizes, the NFIB small business report focuses exclusively on small and independent business owners. While there is no official definition of a small business, it is noteworthy that firms with fewer than 250 employees account for approximately 68% of total employment and as much as 99% of all establishments.[4] Most likely, not all of them are represented in the NFIB survey, but it certainly adds a lot of significance to the state of the economy if the survey serves as a proxy for overall sentiment.
Such a divergence can also be seen in profits. Chart 5 compares the year-over-year change in operating profits of S&P 500 companies with corporate profits as reported in the national accounts (which reflect the overall economy).
Chart 5: Comparing Wall Street profits with economy-wide corporate profits
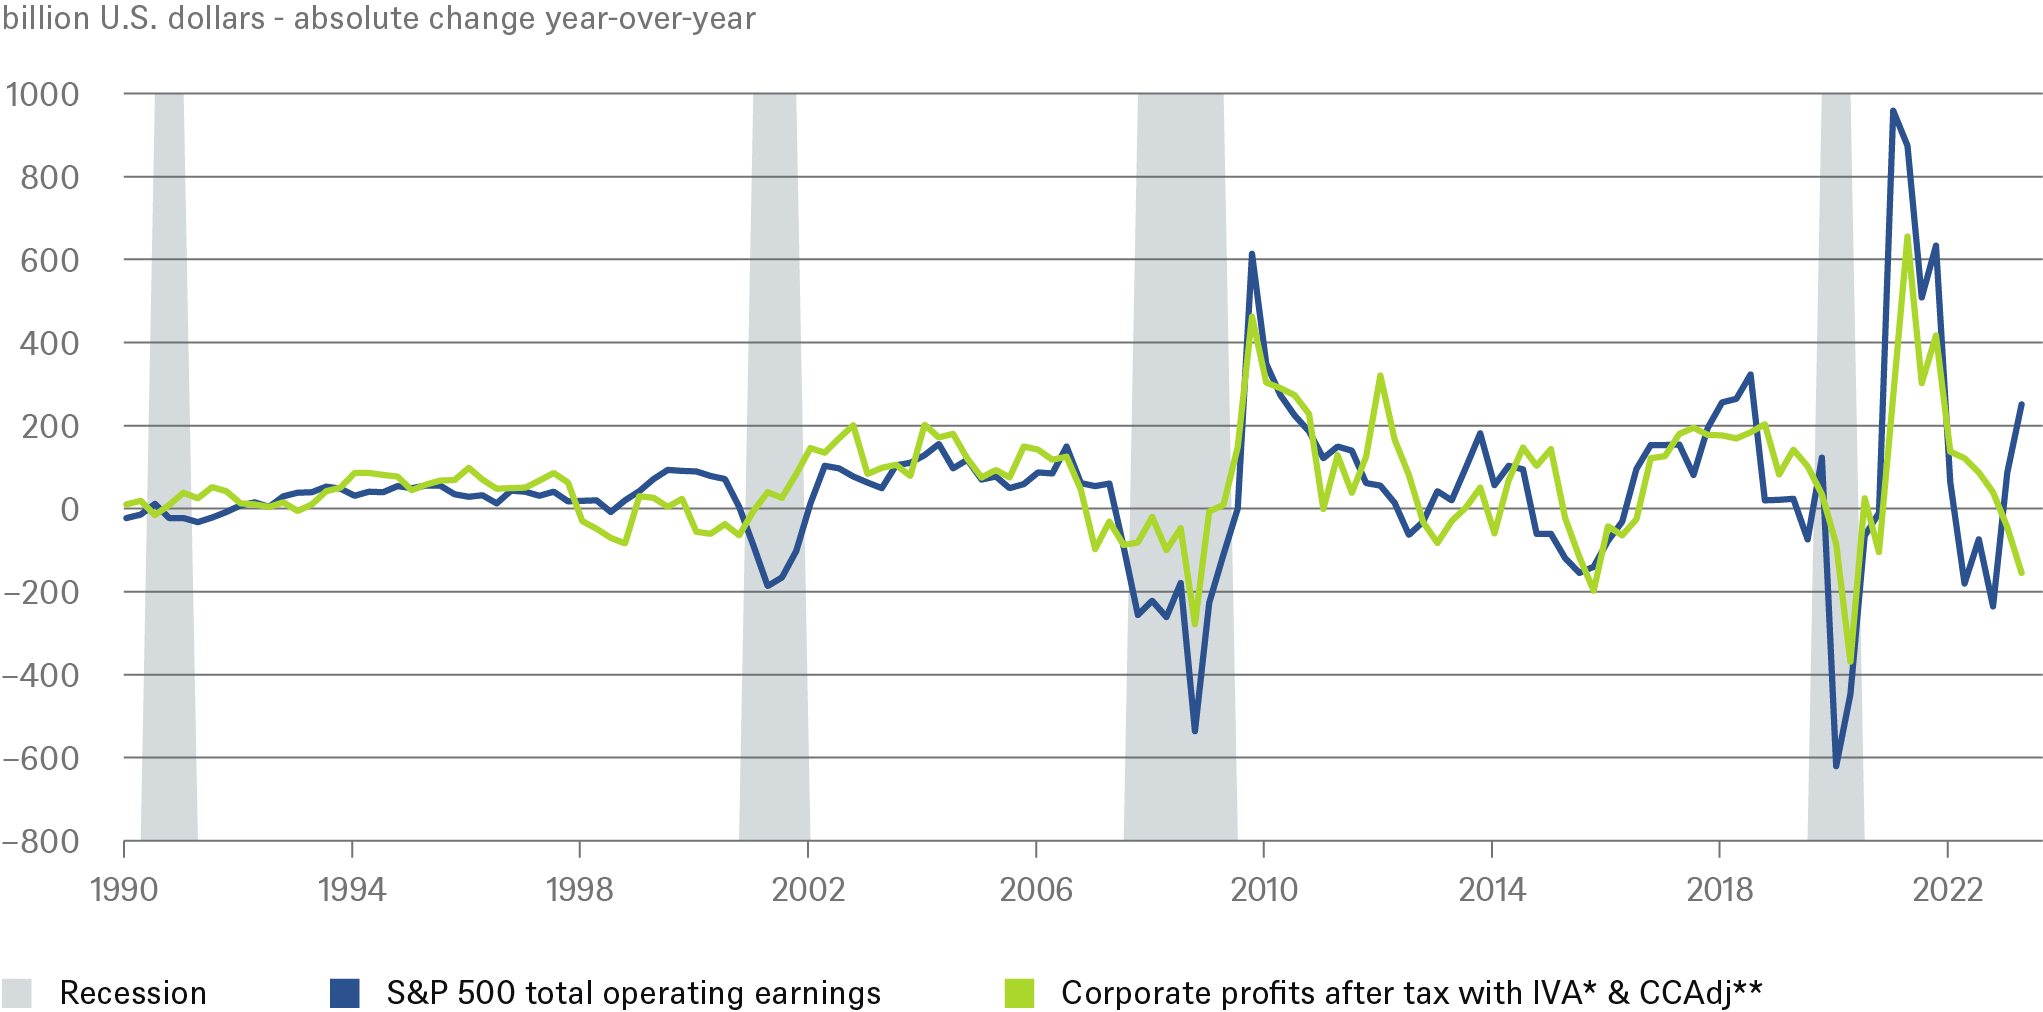
Sources: Standard & Poor's (S&P), U.S. Bureau of Economic Analysis, Haver Analytics as of 9/19/2023
*Inventory Valuation Adjustment (IVA)
**Capital Consumption Adjustment (CCAdj)
The divergence we are now seeing is quite hefty. We will leave it to our asset class colleagues to comment on the implications for earnings quality of the numbers reported by publicly traded companies. From a macro-economic perspective, we would merely highlight that publicly traded companies tend to be larger and more powerful, have significantly outperformed the general economy and may indeed be better able to navigate the high inflation/high interest rate environment, at least initially. Furthermore, this divergence may also help solve another "divergence puzzle" that economists and central bankers are currently facing. Typically, economic activity is measured by the familiar concept of Gross Domestic Product, which summarizes the (real) value of all goods and services produced in the economy. GDP's twin sister would be gross national income (GDI), which measures the total income received by all sectors of the economy. In a theoretical context, both measures would be equal, since every dollar spent on goods and services represents income to businesses, households, or the government. In reality, however, so-called statistical discrepancies arise because the two concepts use different inputs (Chart 6).
Chart 6: Divergence between GDI and GDP largest on record!
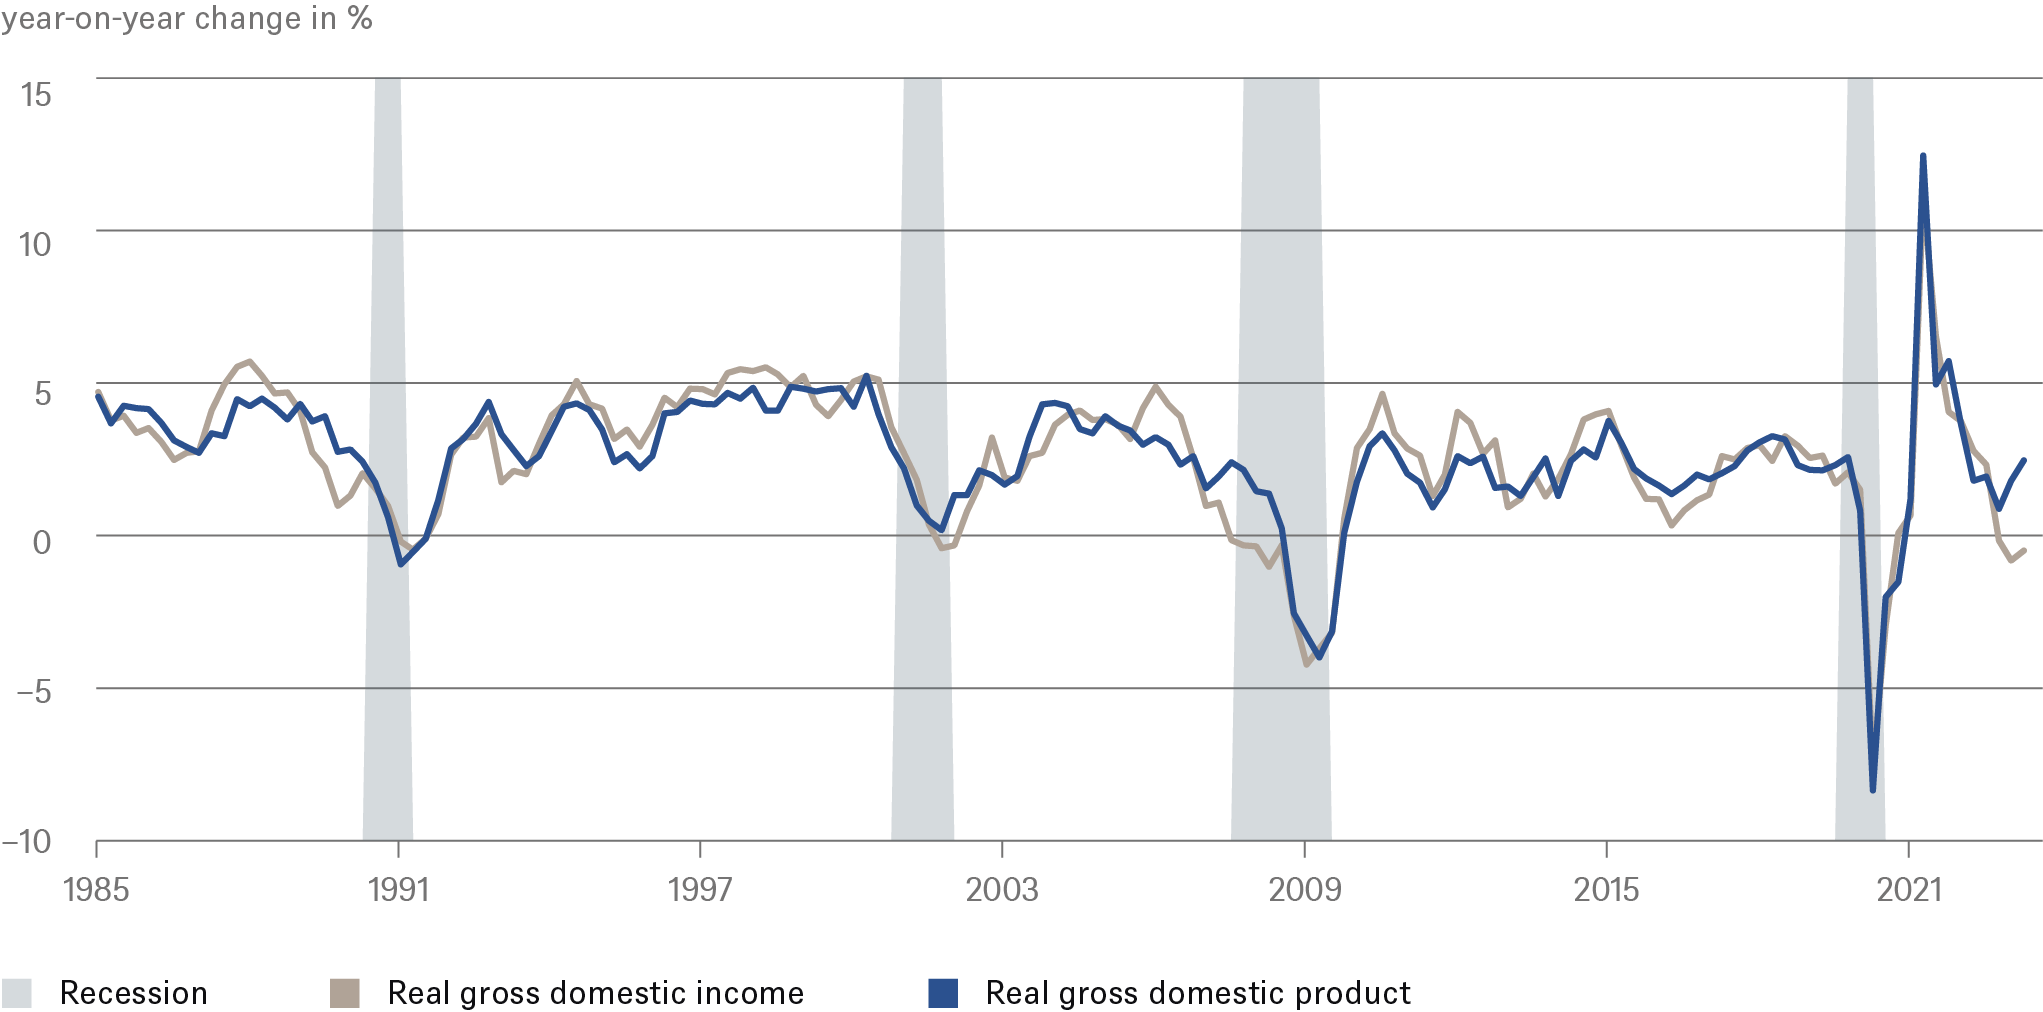
Sources: National Bureau of Economic Research (NBER), U.S. Bureau of Economic Analysis, Haver Analytics as of 9/19/2023
It is interesting to note that past cycles tend to be prolonged when Gross Domestic Income (GDI) growth was reported faster than GDP, and that downturns occur sometimes (as in the late 1980s and just before the GFC) when GDP growth significantly outpaces GDI growth. Since the recent divergence is likely driven by lower corporate profits (wages have held up well so far), it appears that corporate America is not in as good a shape as reports from publicly traded companies suggest. And since profitability tends to drive hiring, we expect more weakness on the demand side of the labor market going forward. This, in turn, is likely to put further pressure on wage growth and thus on consumption and, ultimately, on inflation. Furthermore, research by the Cleveland Fed finds that the "...initial discrepancy has some predictive information about revisions to lagged GDP growth, but no predictive information about revisions to lagged GDI growth".[5] The implication, if the findings hold, would be that recent strong growth numbers are at risk of being revised lower, further signaling that the Fed's medicine is indeed working already.
To sum up, the situation is, the economy is still adjusting to the massive pandemic shock, and imbalances remain significant, as evidenced by profits, GDP and GDI gaps, and labor market imbalances. We have reasonable doubts that these adjustments can take place in a perfectly smooth manner that most like to call a soft landing. Instead, we think the landing will be a bit rougher, resulting in what we call a soft recession. In such a scenario, we do not expect economic growth to fall off a cliff, nor do we expect unemployment to be excessive. Rather, we think of it as hitting the runway with significant skid marks, slowing the economy down so that imbalances can resolve. But it remains a close call, and we assign a 60% probability to our baseline scenario.
We believe the Fed is also aware of these risks. Recently, central bankers seem to have shifted their focus somewhat away from a pure fight against inflation to a more balanced assessment of risks, including downside risks to economic growth. In the very short term, however, they do not need to market this narrative. In any case, the latest data takes some pressure off the Fed by supporting a data-dependent, although hawkish, "on hold" while central bankers continue to assess the ultimate impact of higher rates on the economy. We believe the outcome of this assessment will be a Fed that does not raise rates further this year, and that the next major discussion will be about how much to cut rates in 2024 - once inflation is sufficiently close to 2%. We expect the Fed to begin a series of quarterly adjustment cuts in May 2024.
Overview: key economic indicators
| 2023 | 2024 | |||||||
|---|---|---|---|---|---|---|---|---|
| Q1 | Q2F** | Q3F** | Q4F** | Q1F** | Q2F** | Q3F** | Q4F** | |
|
GDP (% qoq, annualized) |
2.0 |
2.1 |
2.0 |
-0.7 |
-0.8 |
1.0 |
1.0 |
1.2 |
|
Core inflation (% yoy)* |
4.6 |
4.1 |
3.7 |
3.5 |
3.2 |
2.5 |
2.4 |
2.4 |
|
Headline inflation (% yoy)* |
4.2 |
3.0 |
3.5 |
3.3 |
2.8 |
2.5 |
2.4 |
2.3 |
|
Unemployment rate (%) |
3.5 |
3.6 |
3.8 |
4.1 |
4.2 |
4.3 |
4.4 |
4.4 |
|
Fiscal balance (% of GDP) |
|
|
|
-5.6 |
|
|
|
-5.6 |
|
4.75 - 5 |
5 - 5.25 |
5.25 - 5.5 |
5.25 - 5.5 |
5.25 - 5.5 |
5 - 5.25 |
4.75 - 5 |
4.5 - 4.75 |
*PCE Price Index
** Forecast
Source: DWS Investment GmbH as of September 2023
Forecasts are not a reliable indicator of future returns. Forecasts are based on assumptions, estimates, views and hypothetical models or analyses, which might prove inaccurate or incorrect.


