Recent market volatility has reflected uncertainty in both economic and market conditions going forward. Global central bank policy, for the most part, has sharply pivoted toward quantitative tightening and interest rate hikes, with strong commitment from the Federal Reserve (“Fed”) to prioritize the stemming of inflationary pressures even at the expense of economic activity. Looking out over the coming years, a couple of key questions remain
- What are the implications of quantitative tightening on real interest rates, and how might this affect equity valuations?
- How will slowing economic activity impact what has thus far been a resilient corporate earnings outlook?
- Has investor sentiment declined significantly enough to indicate the potential for a strong risk-on rally if macroeconomic and interest rate continues stabilize?
- Will inflationary pressures persist, or is the worst behind us?
1. The great liquidity unwind
Since the global financial crisis, global monetary, and more recently, fiscal, policy has lent unprecedented support for economic growth and the stability of financial assets. The growth of the Fed balance sheet reached its apex of nearly $9tr in 2022 following renewed dovish policy in reaction to the COVID-19 crisis. As inflationary pressures have persisted beyond where the Fed previously anticipated, Chairman Powell has pivoted dramatically toward a restrictive policy, including quantitative tightening. Going forward, the Fed balance sheet reduction is expected to be $95bn per month, which is to be achieved not by an outright sale of assets, but rather a change in the rate of reinvestment.
Exhibit 1: US Condition of All Federal Reserve Banks Total Assets ($ millions)
Entering a cycle of significant quantitative tightening and a torrid pace of interest rate hikes, investors are left to question what level of real interest rate is expected to prevail when the economy is operating at its full sustainable level. Establishing a stable long-term discount rate is an integral step for fundamental investors to determine the steady state multiple and fair value on risk assets.
In addition to the significant liquidity injections the Fed has provided since the Global Financial Crisis (GFC), fiscal stimulus has also played an important role in stabilizing recent periods of market volatility. Looking at the COVID-19 crisis between 2020 and 2022, the total fiscal stimulus amounted to 2.6 times the size of the stimulus provided during the 2008 credit crisis as a percentage of the GDP and played an important role in the historically rapid pace of economic and market recovery. Given the high likelihood of a divided government post the midterm elections, it is unlikely that an additional fiscal stimulus package beyond the recent Inflation Reduction Act of 2022 will be passed to dampen the extent of an economic downturn.
Exhibit 2: Fiscal stimulus as a percentage of GDP
What does this mean for equity markets? In recent years, equity valuations have been supported at elevated levels in part due to low and often negative real interest rates. As the discount rate rose dramatically in recent months, equity multiples have commensurately moved lower. Should the level of real interest rates find stability at the current level, volatility around equity valuations may also subside. Exhibit 3 shows that, particularly when combined with measures of market uncertainty such as the Chicago Board Options Exchange Volatility Index, more commonly referred to as the VIX, the level of the 10yr real treasury yield has done a good job of explaining the forward price-to-earnings multiple of the US equity market.
Exhibit 3: S&P 500 NTM PEs versus model of 10yr real yields and VIX Index
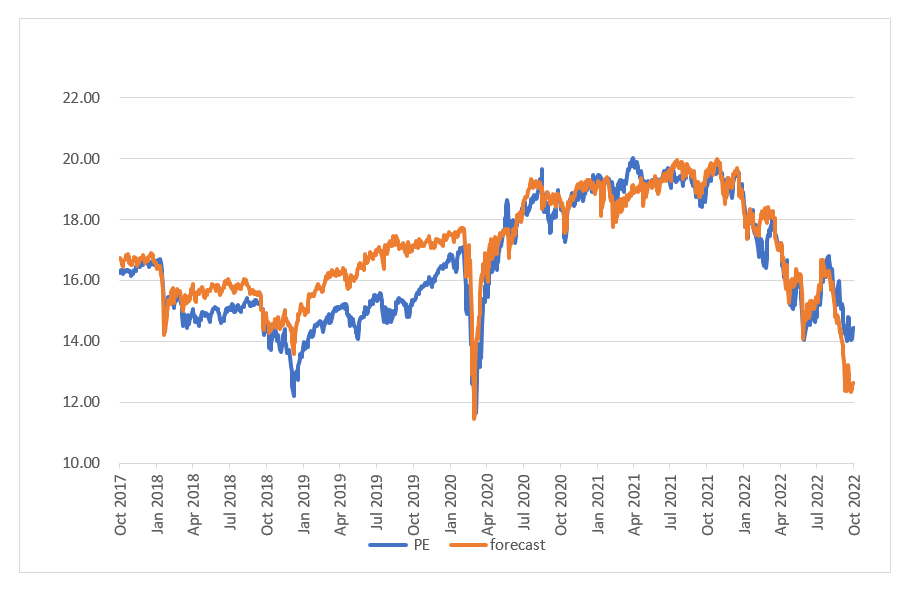
Source: Factset, CBOE, DWS Calculations as of 10/11/2022
2. Have earnings peaked?
In addition to the change in liquidity conditions, the sustainability of current margin levels remains a question. Despite significant price pressures, corporations have continued to generate record earnings, maintaining pricing power across many segments of the economy. Exhibit 4 shows that both defensive and cyclical markets alike in Europe are still trading near or at peak earnings per share.
Exhibit 4: MSCI Europe Cyclical and Defensive Distance from Historical Peak in EPS (%)
While the current peak in earnings across both defensive and cyclical segments of the equity markets does not necessarily indicate an ensuing decline in corporate earnings, history suggests it is likely that the behavior in market prices as well as the slowing macroeconomic growth outlook would lead to downward revisions in the outlook for corporate earnings over the next few quarters.
Comparing the behavior of the S&P 500 to its underlying 12-month forward earnings outlook, we can draw some parallels to the market selloffs in 2008 and during the onset the COVID-19 crisis in early 2020. As with those scenarios, we see a divergence between falling equity levels and what appear to be still stable and, in some cases, rising earnings outlooks. There is a lead-lag relation where the market appears to anticipate declines in earnings not yet reflected in consensus estimates.
Similarly, the inflection point in S&P 500 prices in 2009 preceded the reversal in corporate earnings forecasts by a few months. The recovery in 2020, which was historically fast, also began ahead of the turnaround in corporate profits. In this kind of macroeconomic backdrop, positive earnings momentum is difficult to sustain as economic activity is slowing and leading economic indicators such as ISM New Orders which have been a strong leading indicator of S&P 500 forward EPS are approaching contraction levels (<50).
Exhibit 5: MSCI USA 12m Fwd EPS vs equity price


Source: Bloomberg, Factset as of 9/12/2022
Historically speaking, this anticipated earnings decline is a reasonable expectation given choppy macroeconomic conditions, particularly as interest rates are moving higher. Earnings are difficult to sustain momentum as economic activity is slowing. In general, economic indicators such as ISM New Orders have been a strong leading indicator of S&P 500 forward EPS.
Exhibit 6: ISM Manufacturing New Orders versus MSCI USA 12m Forward EPS

Source: Bloomberg, Institute for Supply Management, DWS Calculations as of 9/121/2022
3. Could a reversal in market sentiment help propel a recovery in risk assets?
While we agree that investors are right to anticipate a decline in corporate earnings, depressed investor sentiment leaves the potential for positive surprises and for rebalancing back into equities to act as a tailwind for risk markets. Across various measures of invest positioning such as Bank of America’s Fund Manager Survey, multi-asset investors are significantly underweight equities relative to their benchmarks. Any potential reversal in these underweights would be a strong tailwind for risk assets.
The American Association of Individual Investors (AAII) indices, which survey investors on their outlook for the stock market over the next 6 months, also show unusually depressed market sentiments. The 4-week moving average differential between the percentage of survey participants with a bullish outlook versus those with a bearish outlook (58.1% and 20.5%, respectively), is among the most negative points in the history of the indices.
Exhibit 7: AAII Sentiment Bullish readings minus Bearish readings 4-week moving average (%)

Source: American Association of Individual Investors, Bloomberg as of 10/12/20222
4. Has inflation peaked?
While it’s difficult to predict the degree to which inflation will normalize over the coming quarters, we do see some evidence when looking at leading indicators across segments of the consumer price basket. For example, after peaking in May of this year, the S&P GSCI Grains price index, which leads the food and beverage CPI component, has declined over 20%. Similarly, while housing prices have remained stubbornly resilient in the face of slowing economic growth and significantly higher mortgage interest rates, expectations around the change in apartment rental prices—historically a more timely indicator of changes in housing conditions—have showed sights of slowing. Exhibit 8 shows the change in both median new home prices and expected apartment rental prices over the next year.
Exhibit 8: Median new home prices and apartment average rental price change expectations over the next 12 months

Source: Bloomberg,as of 8/31/2022
Market-based measures of forward-looking inflation have also come down considerably since peaking in March of this year. Across the treasury inflation protection breakeven curve, inflation breakevens have moderated significantly, perhaps indicating that market participants believe the Fed’s aggressive actions and guidance on interest rate hikes and quantitative tightening will be sufficient to help stabilize prices. Exhibit 9 shows the decline in the 2yr, 5yr, and 10yr TIPS breakeven levels from earlier in the year.
Exhibit 9: TIPS inflation breakevens

Source: Bloomberg as of 10/10/2022
With a lower neutral level on real interest rates (or the discount rate), steady state equity multiples would be meaningfully higher, justifying higher equity prices even amid a moderate decline in corporate profits. Should inflationary pressures continue to show signs of slowing, our view on equity markets would be increasingly constructive.