- Home »
- Insights »
- CIO View »
- Investment Traffic Lights »
- Investment Traffic Lights

- Based on a very strong first quarter for equity markets and a better-than-expected U.S. economy, we have formulated our new 12-month targets.
- We have become more optimistic about equities and see the S&P 500 at 5,300 and the DAX at 18,700. Japan remains our favorite.
- The European Central Bank could cut rates earlier and more often than the U.S. Federal Reserve in 2024. We like shorter-dated government and corporate bonds.
1 / Market overview
1.1 Investors kick off the year of expected rate cuts with euphoria
It runs and runs and runs. What was once true of the Volkswagen Beetle is now true of the capital markets, especially equities. With a gain of 8.5%, the MSCI World had its best first quarter since 2019. And when the markets keep going it's called "momentum," and those with a momentum investment strategy moved ahead by as much as 20%.[1]The rally was largely fueled by better-than-expected U.S. economic data and continued euphoria over Artificial Intelligence (AI)-related products. Even the Chinese stock market was able to post some gains, likely due to government support measures, as well as record low valuations. In neighboring Japan, on the other hand, stocks soared as the end of more than eight years of negative interest rates fostered optimism.
The fact that equity markets fared so well in the first quarter, despite a slight rise in government bond yields and reduced investor hopes for Federal Reserve (Fed) rate cuts this year, suggests greater confidence in the economy. In particular, concerns about a serious U.S. slowdown appear to have abated. At its last meeting on March 20 the Fed seemed to confirm that its view was essentially the Goldilocks one - inflation will be tamed and the economy will stay sound. Even warnings from the Congressional Budget Office that the U.S. debt mountain is on an unprecedented upward trajectory failed to deter the markets.[2] Nor did the fact that the U.S. yield curve (2-year and 10-year) has been inverted for almost 600 days, a post-war record.
As earnings expectations have barely risen in recent months, price gains have been driven primarily by falling equity risk premiums. While the so-called Magnificent 7, i.e. the largest U.S. technology stocks, set the tone for the entire first quarter, they only moved sideways in March. In other words, the rally was broad-based. In general, in the U.S. (though not only there), there has been a huge increase in the value of different asset classes since last October. Equities have risen by $10.9 trillion and bonds by $2.6 trillion. These sums are equivalent to 70% of U.S. consumer spending in 2023.[3] Add to this the rise in the value of cryptocurrencies and real estate and it is reasonable to assume that a self-reinforcing effect is in place: thanks to wealth effects, more is being consumed and invested, which in turn drives up prices in the capital markets.
1.2 Strong equities and weak bonds in Q1
Several equity indices hit all-time highs in the first quarter. The S&P 500 rose by slightly more than 10% in the first quarter, its first double-digit quarterly gain in more than a decade. In Japan the Nikkei posted its strongest performance since the second quarter of 2009 and finally surpassed its previous record high, set in 1989. But while risky assets performed well, bonds underperformed as stubborn inflation and the strength of the economy led investors to price in fewer interest rate cuts.[4]
For the markets the most important news in the first quarter was that global economic data continued to surprise to the upside, raising hopes for a soft landing. Positive data surprises gave risk assets a big boost. The S&P 500 (+10%) and the Stoxx 600 (+7%) ended the quarter at record highs, having posted steady gains in January, February and March. Risk asset strength was evident in other areas as well: Credit spreads on high-risk securities tightened, oil prices rose – with the conflict in Gaza also a factor – and cryptocurrencies had a very strong quarter.

2 / Outlook and changes
As this edition of the Investment Traffic Lights marks the beginning of a new quarter we will concentrate less on tactical changes and more on our new, 12-month strategic forecasts, formulated in mid-March. We have a cautiously optimistic economic outlook (2024 GDP growth for U.S. at 1.8%, EUZ 0.7% and Japan 0.5%), and our base case is that inflation will gradually recede further, enabling central banks to cut rates and providing tailwinds for both equities and bonds. There are various risks to the base case, however – above all geopolitics, the U.S. twin deficit, and the possibility of a new wave of inflation. In addition, most risk assets are already highly valued, leaving little upside. While markets are not yet euphoric, they still seem to be relying heavily on the goldilocks story playing out nicely. But this means there will be extreme nervousness about every major U.S. economic data release. The U.S. presidential election is also a source of high tension. But predicting an outcome at this point seems premature to us.
2.1 Fixed Income
What seems to be already clear is that the major central banks will start cutting rates in 2024. At least, that seems clear now: We have seen how fast convictions can shift over the past couple of months. In October 2023 the markets expected a 20 basis points (bps) rate cut by June 2024; by late December the expectation was 80bps; now we are back down at only about 20bps. And what seemed unthinkable for some market participants until recently is currently also priced in by markets: that the European Central Bank (ECB) may start cutting before the Fed. Investors also now expect more 25bps cuts from the ECB – four – than from the Fed – three – by the end of the year. What seems certain now may not be. And concentrating on the underlying, longer-term picture, we see remarkably little change since our year-end outlook.
Our expectation is that the European Central Bank (ECB) and the U.S. Federal Reserve will begin a gradual normalization of policy rates by mid-year. We see the Fed funds rate at 4.50% to 4.75% by March 2025, and the ECB deposit rate at 3%. We forecast that the Bank of Japan (BoJ) will probably hike the policy rate to +0.25% over the current 12 month forecasting horizon, to March 2025. But the impact of U.S. elections this year on asset prices is hard to predict. We expect volatility to pick up in line with historical experience in the run up to the elections. Many market forecasts are likely to be revised once a clearer picture emerges not just on the likely outcome of the election but also on how market participants interpret it.
Government Bonds
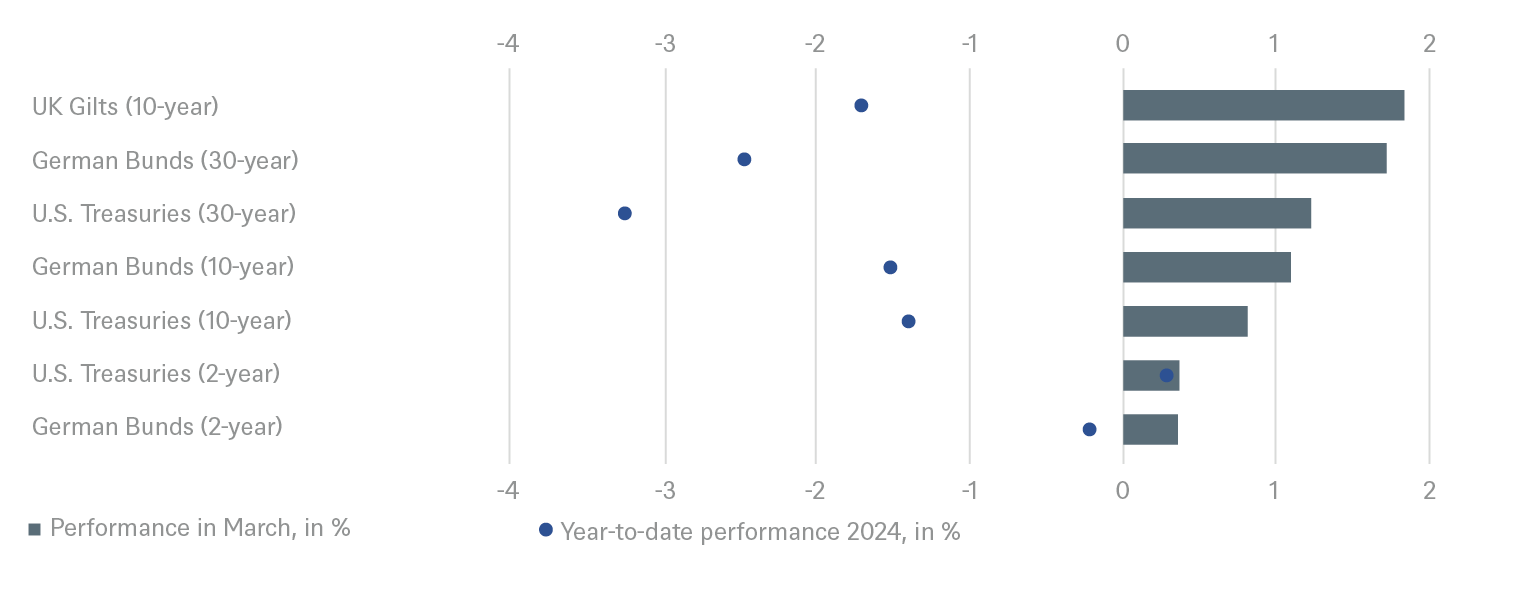
For developed market sovereigns, such as Bunds and U.S. Treasuries, we see the best risk-adjusted returns at the shorter to middle part of the maturity spectrum. Once rate cutting starts, probably in the summer months, we expect current high money market fund balances to move into short duration sovereign debt. Falling inflation and moderating growth should therefore be supportive for a steepening at the front-end of the curve. We expect Bund yields to hit 2.5% and 2.6% in March 2025 for 2- and 10-years respectively. For the U.S. we expect 3.95% and 4.20% for 2- and 10-years respectively.
Rising yields for U.S. Treasuries and Bunds since the start of the year
Source: Bloomberg Finance L.P., DWS Investment GmbH as of 4/2/24
Corporate Bonds
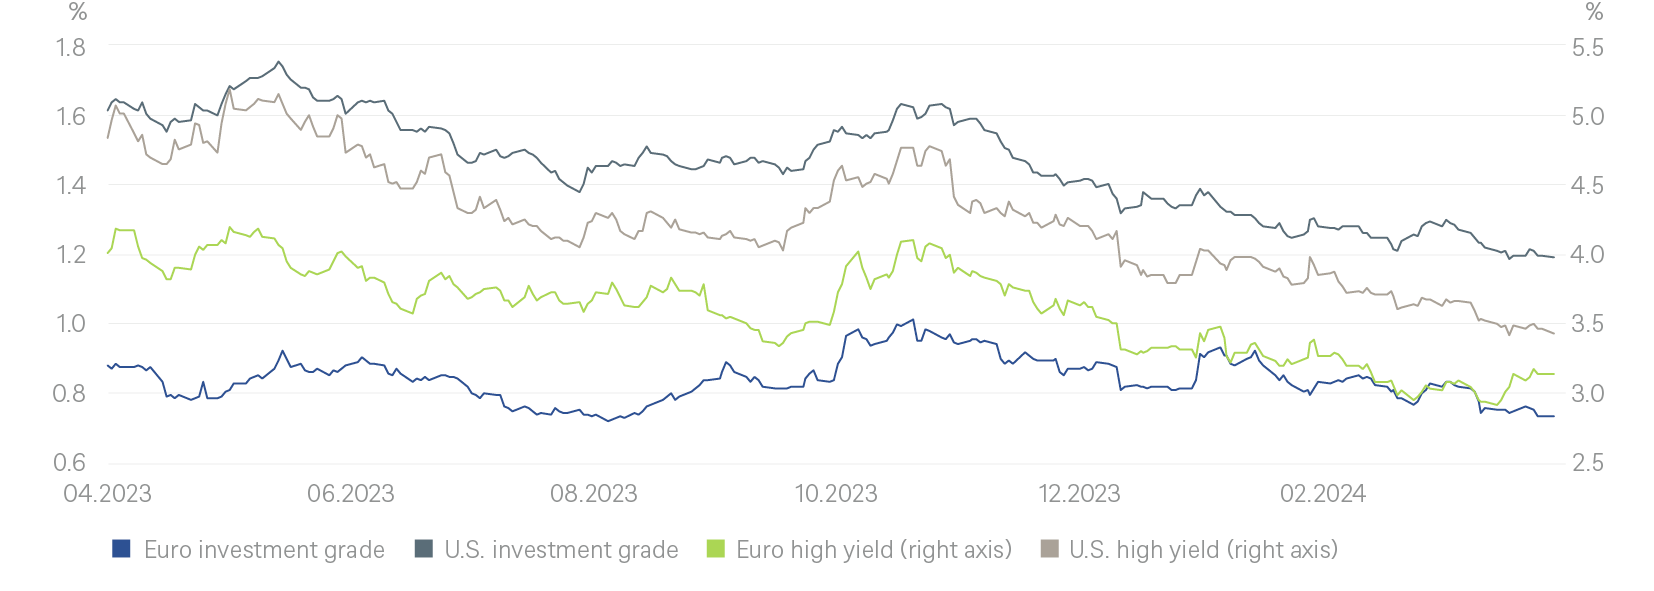
Against this backdrop we remain positive on Euro investment grade (IG) corporate bonds, where we expect further spread tightening. High quality covered bonds still look fine, even if the valuations are not that compelling following the recent swap spread tightening. Other investment opportunities we like include bonds with an ESG focus, such as Next-Generation EU new issuance.
Selection remains critical for all spread-priced fixed income assets. For example, both dollar and Euro high yield (HY) corporate bonds have benefited from the enthusiastic mood in recent months that has boosted risky assets of all sorts. Given higher refinancing costs, this could leave some HY issuers vulnerable to setbacks, whenever sentiment deteriorates. Whether to consider wider HY spreads as buying opportunities, though, hinges in part on corporate fundamentals. Though these mostly remain strong, detailed attention is required in uncertain times, issuer by issuer and bond by bond. On the plus side, it is worth keeping in mind that credit – unlike nominal sovereign bonds – can implicitly buffer some degree of inflation, by boosting nominal revenues.
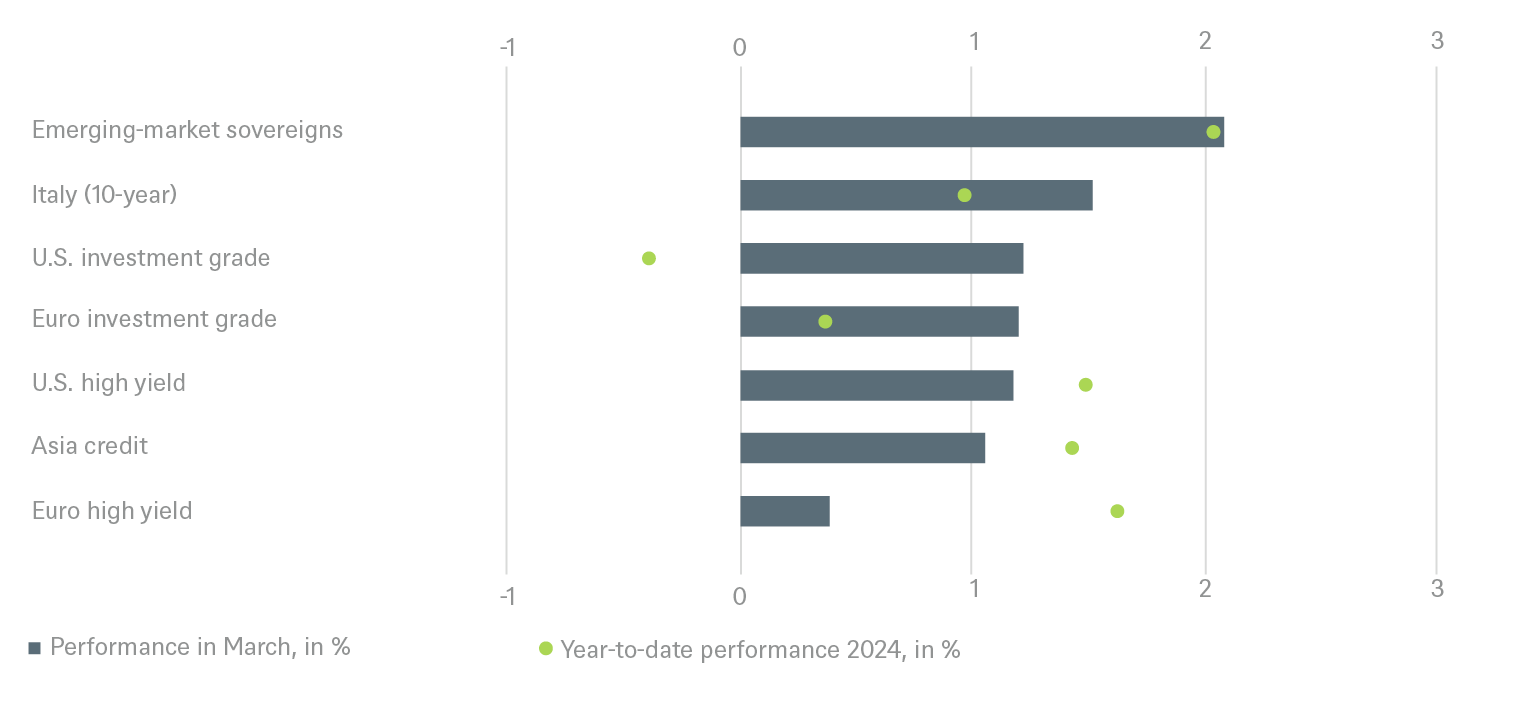
Positive performance for credit
Emerging Markets
We generally favor euro-denominated IG-rated emerging markets bonds over their U.S. dollar denominated higher risk peers, but caution that such investments need to be judged on a case-by-case basis.
Currencies
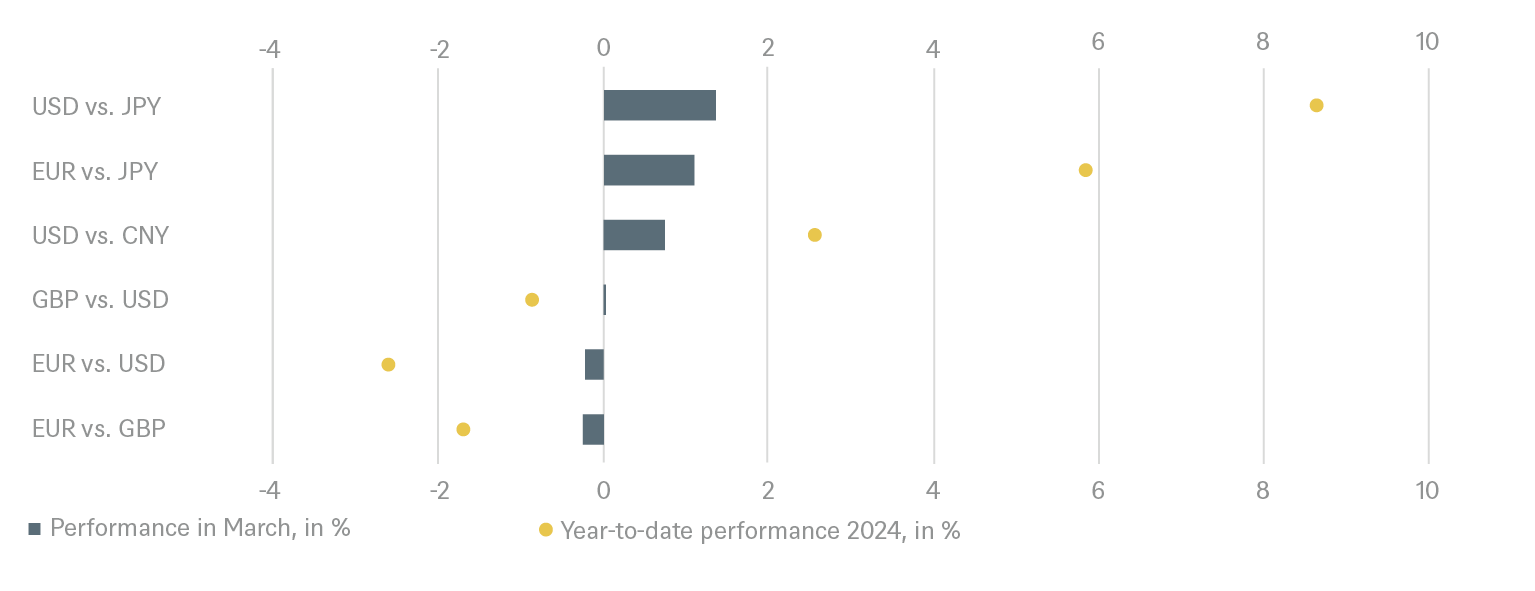
The dollar should generally be supported by the soft-landing scenario. The euro is expected to move mostly sideways against the greenback as the Fed and the ECB seem to be in sync, but next month's inflation data will likely be crucial. Our March 2025 target for EUR/USD is 1.10.
In Japan, the Bank of Japan (BoJ) is expected to continue raising interest rates, which should prove supportive for the Yen against the Dollar. Our 12-month target is 145. The British Pound should be weighed down by the weak economic outlook, but the Bank of England (BoE) could remain hawkish for some time as inflation in the UK still has the potential to prove sticky. The pound seems set to trade sideways against the dollar.
In China the National People's Congress has announced substantial fiscal and monetary support for the economy. However, capital outflows continue to weigh on the currency. On a 12-month horizon the dollar should strengthen slightly to 7.35 against the Chinese yuan (CNY).
2.2 Equities
Five months ago, we believed that equity investors would not be scared by temporary economic weakness and instead focus on the light at the end of the tunnel as falling inflation would allow the Fed to cut rates from June 2024; in combination with a forecast acceleration of earnings growth, this backdrop for equity markets. Now we must acknowledge that though we got the direction right we underestimated the size of the market movements. Emboldened by better-than-expected U.S. economic figures and ongoing Artificial Intelligence (AI) hype, investors have pushed markets to new record highs in the first months of 2024.
We are therefore lifting our index targets and predicting an approximately 5% total return for most markets by March 2025, mainly driven by higher assumed price/earnings (PE) multiples. However, we keep our next 12-months earnings per share (EPS) growth estimates unchanged. Profits should grow most in emerging markets and Japan. S&P 500 earnings are benefiting from high-teens growth among the “magnificent seven” but are expected to progress by 5% for the S&P 493 - the same pace as European earnings. Few industries face cyclically depressed earnings. Most cyclical sectors, like industrials and discretionary consumer stocks, continue to report record high profit-margins but need no upgrades in earnings expectations in our view.
We continue to argue that markets outside the U.S. are trading at a too high discount relative to the U.S yardstick. But we are struggling to identify a catalyst that would prompt meaningful shrinkage in that discount. Therefore, higher investor confidence in the sustainability of EPS growth outside the U.S. will remain key. We continue to like European equities (outperform) as our preferred “value” market and reiterate the continued attractiveness of European banks (outperform vs. global financial sector) due to their valuations and high cash returns to shareholders.
We are downgrading European to outperform from strong outperform, not for fundamental reasons but because equity investors prefer highly-liquid , a phenomenon seen in the U.S., Europe and Japan. The stunning outperformance of the shows this; it replicates an investment strategy that systematically puts money into stocks that have outperformed during the past 12 and 6 months. We note that the global momentum trade into mega-large caps has not only led to a dangerous concentration within active and passive portfolios but also to an extremely high correlation within equity portfolios. This means that equity funds have become less diversified.
Turning to Asia, our outperform recommendation for the MSCI Japan has worked well. However, we are shifting tactically towards neutral ahead of the BoJ’s abandonment of negative interest rates. We keep EM at neutral but are encouraged by the sector’s double-digit EPS growth.
Sectorwise our preferences remain unchanged. Global consumer discretionary and communication services seem to be most attractive to us due to their relative valuation and low unemployment rates.
S&P 500 is up and away
Source: Bloomberg Finance L.P., DWS Investment GmbH as of 4/2/24
U.S. Market
We increase our S&P 500 target to 5,300 based on a forecast of a lower equity risk premium (ERP) and higher PE multiple. We acknowledge that market sentiment suggests a higher "growth premium" in the Price/Earnings (P/E) multiple than previously anticipated. In addition, the macro-outlook has improved; we are no longer expecting a recession. Fed rate cuts should boost the markets. We expect S&P 500 EPS growth of 8% in 2024 to be driven by the so-called great eight stocks and the health care sector. We are raising the trailing PE ratio over the past 12 months to 21.5 times for the S&P 500; this incorporates a "digital PE-premium” due to the increased weighting of technology companies in the index.
European Market
In Europe likely cuts to central bank rates could start a moderate re-acceleration of gross domestic products (GDP) from H2 2024. European earnings have rebounded over the past two years and the earnings growth gap between the U.S. and European market is expected to narrow and be much lower than during the last decade. However, this is yet to be reflected in valuations as Europe is trading at a multiple decade high discount against the U.S.
German Market
A global economic recovery towards the end of the year should benefit German companies in particular as the German economy is highly export-oriented and the most cyclically exposed of the major economies. Our 12-month target for the DAX is 18,700.
Emerging Markets
While China appears undervalued, company profitability is weak, with limited potential for margin improvement. Confidence remains low despite government support. India, on the other hand, remains attractive on a top-down basis. Valuations are not favorable, although financials are currently valued more attractively. India faces no commodity headwinds, and the higher oil price is not a stumbling block. The elections are expected to deliver a market-friendly outcome.
Japan
The view on Japan is very positive strategically. Tourism and an eventual China recovery might prove supportive. Structurally, the return of inflation and improving corporate governance are benefits, too.
2.3 Alternatives
The rapid rise in interest rates in 2022 and 2023 had its impact too on many alternative asset classes. We believe that the repricing has largely run its course and that markets are settling into new supply-demand equilibriums. That should start to attract back buyers who have been on the sidelines over the past two years.
Real Estate
A rebound in listed REIT pricing in late-2023 augurs well for private real estate, which typically follows with a 9-12-month time lag. We still have to go through a bit more repricing probably in the period to mid-2024. Accordingly, the investment market is subdued, but buyers and sellers are aligning their price expectations, which should gradually revive prime market activity. Meanwhile, construction starts are plunging, paving the way for tighter market conditions and stronger rental growth later this year and into 2025. Office space in the U.S. is the weak link; it’s better in Europe and Asia. Retail is very strong in the U.S. but softer in other regions. Logistics and residential are our preferred sectors due to strong occupier demand.
Infrastructure
We see a clear improvement in investor sentiment with lower interest rates on the horizon. Europe remains a favored region as it offers good value and well-diversified assets benefiting from strong thematic tailwinds and strategic policy decisions. The energy transition and digitalization remain two key themes driving opportunities. Transportation assets represent a potential way to access these themes as assets return to the market.
Gold
We have raised our target to 2,400 dollar per ounce by the end of March 2025 as we believe the price will be supported by ongoing demand as well as a more accommodative monetary policy. However, for gold to sustain these price gains we need to see the Fed start to normalize interest rates in the second half of 2024, as the market is pricing in expectations of rate cuts. Meanwhile exceptional demand from Asia, strong buying by central banks which want to diversify out of dollars, heightened geopolitical risks and rising global liquidity are factors that continue to support gold.
Oil
We expect prices to be range-bound throughout the year. While we see ample supply in the short term, we expect the markets to be balanced as the year progresses. We expect demand growth to be matched by supply growth, with OPEC attempting to steer the markets. In our base case scenario we assume that Saudi Arabia will extend its voluntary additional production cut of 1 million barrels per day until mid-2024, with crude supply gradually increasing in the second half of the year to offset rising demand, consistent with our global growth path. Recent events in the Middle East have increased geopolitical risk premiums and supported global crude oil prices.
Gold is showing solid performance recently
Source: Bloomberg Finance L.P., DWS Investment GmbH as of 4/2/24
2.4 ESG
CO2 certificates
We have lowered our forecast for CO2 allowances from EUR 95 for December 2024 to EUR 80 for March 2025 due to weakening gas prices, although the announcement of the (MRS, a reserve, which aims to provide stability for the EU emissions trading system (EU ETS) by addressing the current surplus of allowances and to improve the system’s resilience to major shocks by adjusting the supply of allowances to be auctioned) in May is likely to trigger a rise in prices. Warmer, windier, wetter weather and economic weakness have led to a decline in prices of emission allowances (EUA) traded on the European Union’s Emissions Trading Scheme (ETS) since December. The medium to long term outlook remains strong (carbon border tax starts in 2026, EU proposed 2040 carbon targets, emissions cap continues to fall).
European Transformation Scorecard
In addition, we introduced the European Transformation Scorecard . Using quantitative metrics5 measured against their respective 2030 targets, we track 13 European countries on their transformation journeys across (Climate, Energy, Biodiversity, Economic development, Technology, Transportation, Digital, Supply Chain, Urban Resilience, Water, Healthcare, Social).
Our findings show that policy action and investment needs are particularly critical in four key areas: electrifying the transport sector, energy efficiency measures in buildings, improving healthcare outcomes, and achieving decarbonization more broadly. Of the 12 sector transformations, only technology, the digital economy and the social pillar can claim to be gaining some traction.
At the country level, Sweden is the winner, performing strongly in areas such as renewable energy, R&D spending and urban resilience, with the Netherlands and Switzerland as runners-up. At the bottom of the scorecard are Spain, Poland and Italy, all of which have regulatory environments that do not sufficiently encourage private sector investment.[5]
Europe faces an investment gap of at least EUR 2.5 trillion for green and digital goals (EU-27). Europe must therefore continue to innovate and adopt transformative technologies by creating a supportive regulatory environment and prioritizing investment in research and deployment. Deepening the Single Market and completing the Capital Markets Union should help mobilize the private capital urgently needed to achieve Europe's ambitious goals.
3 / Past performance of major financial assets
Total return of major financial assets year-to-date and past month
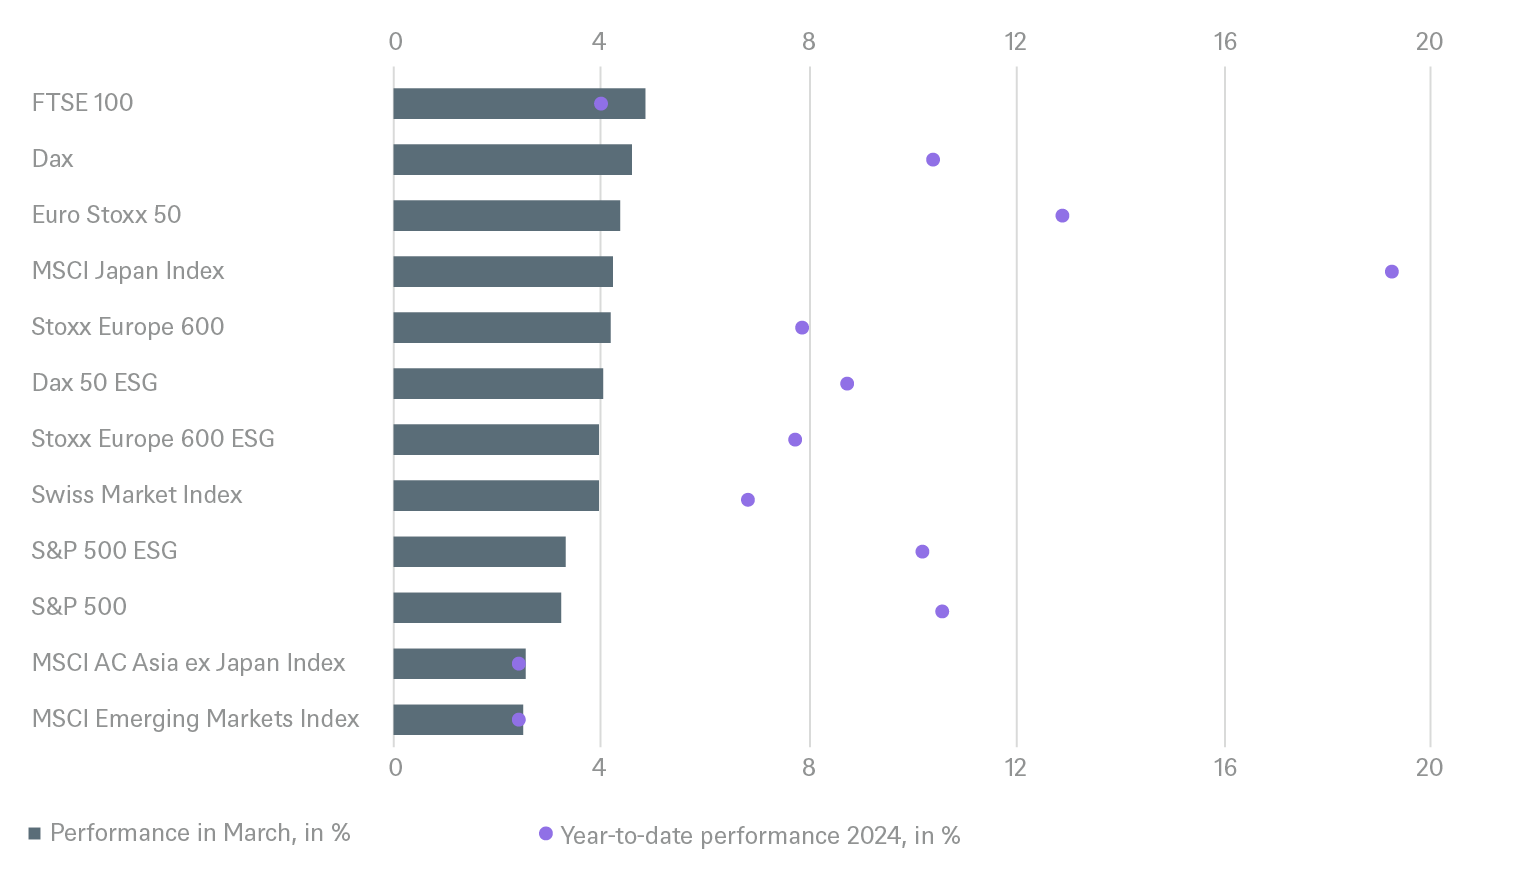
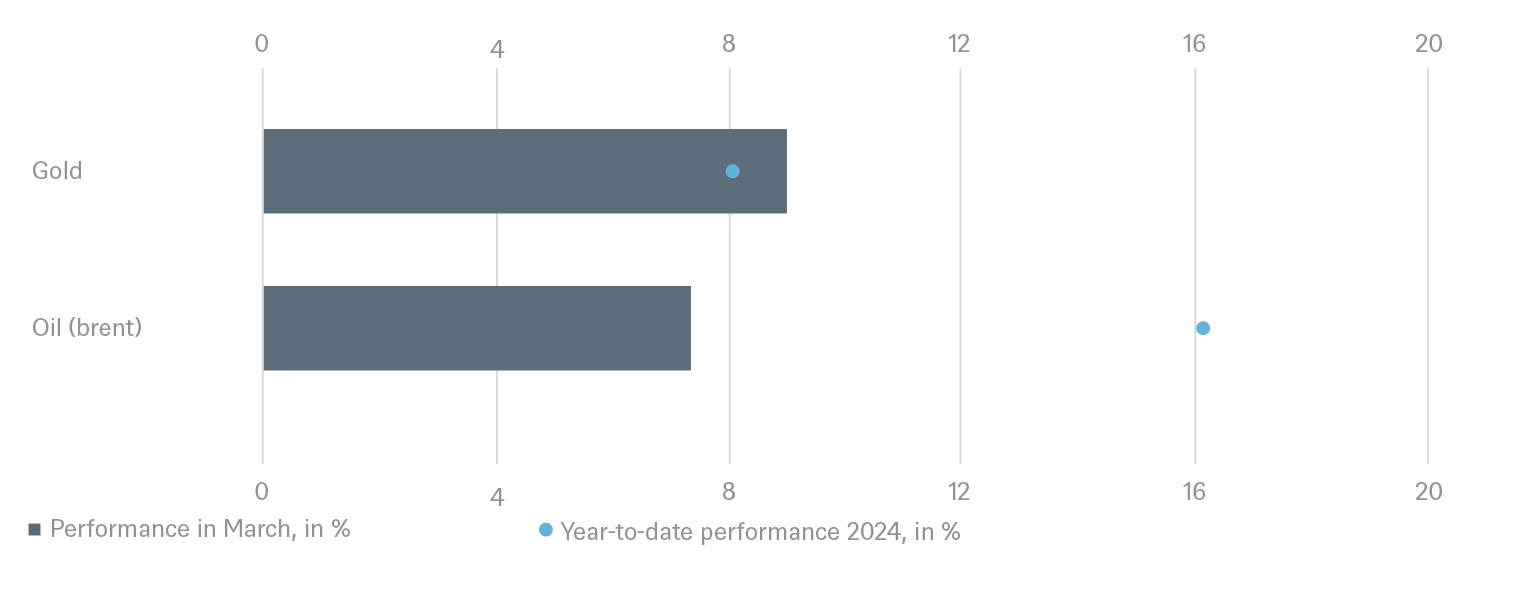
Past performance is not indicative of future returns.
Sources: Bloomberg Finance L.P., DWS Investment GmbH as of 3/29/24
4 / Tactical and strategic signals
The following exhibit depicts our short-term and long-term positioning.
4.1 Fixed Income
Rates |
1 to 3 months |
through Mar 2025 |
|---|---|---|
| U.S. Treasuries (2-year) | ||
| U.S. Treasuries (10-year) | ||
| U.S. Treasuries (30-year) | ||
| German Bunds (2-year) | ||
| German Bunds (10-year) | ||
| German Bunds (30-year) | ||
| UK Gilts (10-year) | ||
| Japanese government bonds (2-year) | ||
| Japanese government bonds (10-year) |
Spreads |
1 to 3 months |
through Mar 2025 |
|---|---|---|
| Italy (10-year)[6] | ||
| U.S. investment grade | ||
| U.S. high yield | ||
| Euro investment grade[6] | ||
| Euro high yield[6] | ||
| Asia credit | ||
| Emerging-market sovereigns |
Securitized / specialties |
1 to 3 months |
through Mar 2025 |
|---|---|---|
| Covered bonds[6] | ||
| U.S. municipal bonds | ||
| U.S. mortgage-backed securities |
Currencies |
1 to 3 months |
through Mar 2025 |
|---|---|---|
| EUR vs. USD | ||
| USD vs. JPY | ||
| EUR vs. JPY | ||
| EUR vs. GBP | ||
| GBP vs. USD | ||
| USD vs. CNY |
4.2 Equity
Regions |
1 to 3 months[7] |
through Mar 2025 |
|---|---|---|
| United States[8] | ||
| Europe[9] | ||
| Eurozone[10] | ||
| Germany[11] | ||
| Switzerland[12] | ||
| United Kingdom (UK)[13] | ||
| Emerging markets[14] | ||
| Asia ex Japan[15] | ||
| Japan[16] |
Style |
1 to 3 months |
|
|---|---|---|
| U.S. small caps[27] | ||
| European small caps[28] |
4.4 Legend
Tactical view (1 to 3 months)
The focus of our tactical view for fixed income is on trends in bond prices.Positive view
Neutral view
Negative view
Strategic view through March 2025
- The focus of our strategic view for sovereign bonds is on bond prices.
- For corporates, securitized/specialties and emerging-market bonds in U.S. dollars, the signals depict the option-adjusted spread over U.S. Treasuries. For bonds denominated in euros, the illustration depicts the spread in comparison with German Bunds. Both spread and sovereign-bond-yield trends influence the bond value. For investors seeking to profit only from spread trends, a hedge against changing interest rates may be a consideration.
- The colors illustrate the return opportunities for long-only investors.
Limited return opportunity as well as downside risk
Negative return potential for long-only investors


