- Home »
- Insights »
- CIO View »
- Investment Traffic Lights »
- Investment Traffic Lights

- Geopolitical crisis in the Middle East meets unstable capital markets in October. But oil does not price in the escalation as demand fears grow.
- Stocks fall for a third month in a row, U.S. Treasuries for a sixth month.
- We are cautious about the turn of the year as high bond yields are continuing to weigh on other asset classes.
1 / Market overview
1.1 High interest yields and new geopolitical tensions weigh on markets
The dominant theme of October was undoubtedly the attack by Hamas on Israel and the subsequent counteroffensive by the Israeli army. This tragic event – with as yet unforeseeable consequences – assailed an already unstable capital market which has not yet shown any signs of switching into its seasonally typical year-end rally mode. Instead, there have been striking price movements in both equities and bonds that are evidence of the nervous mood.
From its intraday high of over 4,600 at the end of July, the S&P 500, had lost over 10% by October 26 and was still trading below the 4,200 mark at the end of the month. On the bond side, the most striking outlier was the yield on 30-year U.S. Treasuries, which jumped above the 5% mark in October for the first time since 2007. While some economic data has surprised on the upside, many leading indicators (especially from the credit market) continue to point to a slowdown in the coming months. On the inflation side, downside surprises outweighed upside surprises on both sides of the Atlantic in October[1] There was also very little movement in 2-year Treasury yields, as well as in expectations of future interest rate moves by the U.S. Federal Reserve (the Fed). It is therefore quite possible that the persistently high U.S. interest rates at the long end no longer reflect only concerns about inflation and the economy, but increasingly concerns about the state of public finances in the U.S. and the question of who is to buy all the high Treasury issues next year.
High U.S. government bond yields have naturally been followed by rises in 30-year U.S. mortgage rates, which have even exceeded the 8% mark for the first time since 2000. It is all the more surprising then that the U.S. consumer remained in fairly good spirits in October, as evidenced by both consumption behavior and consumer confidence, they increasingly resorted to credit to finance the consumption. Other factors include the fact that many homeowners had refinanced long-term at low interest rates in recent years and the still solid labor market.
Other newsworthy items from the past month include disappointing Purchasing Managers Indices (PMI) in October from China, which followed the previously released better than expected third quarter GDP figures. The negative news flow from China’s real estate sector also did not dry up in October. There were also contradictory signals from Japan. While the real economy is holding up well, the further decline in the yen (1.5% weaker against the dollar in October, minus 15% YTD) and the fact that the 10-year government bond yield is pushing towards the 1% mark, a decade-long high, were particularly noticeable. The upper band for the Bank of Japan’s (BoJ) yield curve control (YCC) is likely to be only half-heartedly defended by the central bank – but the BOJ has still not been able to bring itself to completely abandon the YCC.
Finally, a word on corporate quarterly reporting. It is mixed at best in Europe, with some negative outliers especially from the renewable energy sector, while in the U.S. positive surprises slightly outweigh the negative ones so far. However, even in the U.S. the stock market has tended to focus on those companies that failed to meet expectations and has punished them accordingly.
1.2 Third negative equity month in a row
Global equities (MSCI AC World) fell for the third month in a row in October, with value stocks losing 3.4%, more than growth stocks’ 2.4%, which was not necessarily expected given interest rate developments. This development was also seen in other indices. The Nasdaq 100 lost the least with -2.0%, while Latin America and Switzerland brought up the rear, losing around 5%. In terms of sectors, utilities held up best with a minimal drop, while industrials and (discretionary) consumer stocks were hit the hardest, again down by around 5%.
In commodities the focus was on gold and oil due to the new tensions in the Middle East. While gold was able to break through the 2,000-dollar mark for the first time since May, albeit only by a little and temporarily, thus living up to its reputation as a safe haven investment, oil was only briefly impressed and continued its downward trend toward the end of the month (and especially on November 1, when it fell sharply.) Thus investors do not seem to fear an escalation of the Middle East conflict for the time being. A big danger would be if Iran were to be drawn into the fray as we are talking about a country that accounts for around 3% of global oil production and one that could interrupt a fifth of global supply via the Strait of Hormuz by means of sea blockades.
2 / Outlook and changes
The traditional year-end rally will be a tough sell this year. Although many asset prices have, again, become cheaper in October, asset prices don’t look cheap given the cocktail of risks being presented to them currently – to which the Israel-Hamas conflict is a particularly traumatic and dangerous recent addition. Gaza may have dislodged Ukraine from the front pages, but that conflict, too, continues as the world’s geopolitics risks scale new heights.
On the macroeconomic front, too, reassurance is in short supply. Both U.S. and Chinese Q3 growth surprised to the upside but this encouragement might prove to be short-lived, as leading indicators such as PMIs, and credit supply and demand, are weak. Bond markets’ main concern is how long U.S. sovereigns will remain high and to what extent the long end will follow the short end on the way down, as concerns about the health of the U.S Treasury market, given high U.S. debt and the big budget deficit, become more prominent. For equities, meanwhile, high interest rates are not good news. But our central scenario, though cautious, does not see big downside risk, as falling inflation numbers, labor markets that are in good shape, and an end to the global hiking cycle should mean any meaningful recession is avoided.
2.1 Fixed Income
Calling the peak for interest rates in the U.S. and Europe is an exercise for only the brave. But our macroeconomic outlook suggests the peak may have been reached. We believe the current level of carry covers some of the price risk presented by the possibility of further increases in bond yields.
Government Bonds
For most of October we were neutral on most government bonds given their continued upward yield momentum. The exceptions were the 2-year and 10-year U.S. Treasuries where we have stuck to our positive view even if the markets are against us right now. While the door remains open for another rate hike in December or early 2024, it is far from a forgone conclusion. The latest Fed speak is tilted towards “rates are high enough” as financial conditions (real rates) might do the work for central bankers. Also, as our base scenario in the U.S. is still a soft recession, we do not believe yields will make further major upward moves without provoking fears for economy growth which would then, in turn, weigh on yields. We are therefore ready to sit this one out and take advantage of yields near or even above 5%.
Corporate Credit
We are positive across the European Corporate Credit market and neutral on the U.S. We have downgraded U.S. IG credit as rate volatility has been pushing spreads wider. Also, geopolitical risk remains a concern, particularly in the Middle East, which may impact risk sentiment. EUR HY has become attractive with the recent spread widening and an average yield of above 8%. Corporate fundamentals, the default rate, and the rating quality are materially better than implied by the spreads. However, investors need to be prepared for higher volatility due to the geopolitical, macroeconomic, and monetary uncertainty.
Emerging Markets
We have downgraded both EM sovereigns and EM credit to underweight and neutral respectively, as geopolitical developments weigh on risk sentiment. Higher U.S. rates and the global weak growth outlook are further negatives. Amid ongoing outflows the flow picture for EM fixed income remains challenging and country-specific developments in several HY countries could also cause larger moves in spreads.
Currencies
We remain neutral on all of the main currency pairs we cover. U.S. growth has surprised everybody so far and has proven supportive for the dollar. The latest surge in U.S. bond yields is another factor contributing to dollar strength. No change in trend is in sight yet, but the dollar is beginning to look very expensive. Positioning from institutional investors, too, is heavy. We are keeping neutral for the moment.
2.2 Equities - valuations have improved but headwinds abound
Despite the market correction (and the more attractive valuation levels, based on P/E ratios), we remain cautious on equities into year end. High(er) interest rate levels, a mixed start to the earnings season and the ongoing conflict in the Middle East limit the upside for equities in the short term. We upgraded Japanese equities from Neutral to Overweight at the beginning of October, mainly due to stabilizing export figures, solid balance sheets and the expected earnings growth of 5-6% on the Topix over the next 12 months. As for investment styles, there is still a big disconnect between the relatively good performance of cyclicals vs. defensives and rather weak PMI figures. We still believe that European Small and Midcaps offer good value.
Sectorwise, Communication and Consumer Discretionary remain our key overweights while Real Estate stays underweight. Within global Healthcare (neutral) we have downgraded the life science and medtech sectors. For life science companies, valuations are hard to reconcile with their growth outlook. Their customers, which include biotech companies, are struggling with high interest rate environments, have cut their R&D spending, and are facing a backlog of orders built up during the Covid period. For medtech, forward PE multiples of 21x in our opinion are far too rich for the current market and interest rate environment. We prefer to watch both subsectors from the sidelines until there is a reversal in these trends.
We have also downgraded Global Automotive versus Consumer Discretionary to neutral. After two years of extraordinary pricing benefits and EBIT margins, a normalization of sector trends is starting to take place. On top of this, the ongoing price war between Battery Electric Vehicles in combination with slowing demand and growth momentum may prove challenging. This limits the upside and outperformance potential of the sector versus Consumer Discretionary, especially given the 30% outperformance of this sub-sector since 16 November, 2020 (when our call was initiated). The sector clearly saw a short-term peak back in July and has suffered as the equity market has corrected. This may continue and the outlook for FY24 earnings is less positive, given the combined impacts of China (less demand but more exports), higher rates and the impact of higher input prices.
U.S. Market
We see little upside to U.S. equities as the fight with inflation isn’t over, the 5.5% overnight Fed rate is likely to linger, bond yields are continually increasing and rich, unsustainable PE multiples of 20x and at best flattish S&P EPS are further limiting factors. Despite the resilient labor market, a shallow recession is still possible, and the Fed may even hike given stubborn inflation (though this is not our base scenario). Whether the economy slips into a recession or not, a shallow profit recession is underway. 1Q and 2Q EPS are –3% and -6% y/y respectively. We expect flat 3Q y/y earnings growth and positive growth in 4Q. The strong U.S. Dollar as the Fed hikes rates more than other central banks could further weigh on S&P earnings.
European Market
Europe remains attractively priced and is on a record discount to the U.S. (including on a sector-neutral basis). Early indicators in Europe, however, remain cloudy and the Q3 reporting season so far has been mixed at best, with some single companies reporting really disappointing figures. Most recent macro figures (for GDP and inflation) have, however, been slightly better than expected.
German Market
We remain neutral on German equities given short-term uncertainty about recession risk in the U.S. and geopolitical dangers. Sentiment is weak and fundamentals mixed. But valuations are cheap, in line with the entire European market, as the German equity market is trading at a record PE discount to the S&P 500. Nevertheless, while real wage growth should underpin consumption by Q4, China remains weak and might cause negative earnings adjustments. Weak global PMIs, inventory destocking and high interest costs are further worrisome factors.
Japan
We have upgraded Japanese equities to outperform, as they offer good earnings growth and revisions thanks to the weak Yen. There is no risk of central bank action until 2024, with inflation comfortably at 3.5% - 4%, and domestic consumption is stable, and increasingly supported by returning tourists. The return of inflation is supportive for growth in nominal GDP and earnings for the first time in 20 years. For Asian investors Japan is, therefore, a good alternative to China. At the moment most global investors are still underweight, and a potential recovery in the Chinese and global economy could be an additional growth driver. We want to use this opportunity and have tactically upgraded Japanese equities to overweight.
Emerging Markets
We remain neutral on Emerging Market equities as “no China, no party” still holds true. Chinese economic data is stabilizing at a low base but is not showing much sign of further recovery. Cheap valuations are not supportive either but rather a value trap as long as investors are pulling money out of shares. Further risks to the downside include a stronger U.S dollar, inflation risk stemming particularly from higher oil prices, a more severe recession causing a drag on growth, and intensifying geopolitical risks.
2.3 Alternatives
Gold
At the end of October gold topped out just above USD 2,000/oz before settling near USD 1,985/oz. Overall, precious metals have continued to outperform, led by gold, and we see further upside in them. Risk concerns have helped the gold price move up but it has also benefited from Fed officials’ comments about the peak for nominal rates being close. We expect that there will be potential for rate cuts next year to support the slowing economy and see this as likely to be very beneficial for gold prices – as are expected continued high levels of purchases by central banks.
Oil
The oil price continues to be choppy as tensions in the Middle East largely offset investors’ worries about the decline in global demand. At the end of October, however, the oil price moved lower, further pricing out the short-term risk premium from the Israel/Hamas conflict. From a fundamental perspective, the International Energy Agency (IEA) in its annual World Energy Outlook gave a more cautious view of oil demand: It brought forward the peak for oil demand by about 5 years to the late 2020s in its base Stated Policies Scenario. On the supply side, the combined share of OPEC and Russia is expected to account for half of global supply by 2050, led by Saudi Arabia. Demand for both gasoline and diesel remains soft in the short term. In our view it appears that the only thing that could move crude oil prices higher in 4Q is a further escalation of conflict in the Middle East. Otherwise, supplies are not likely to tighten in Q4 and demand, particularly for jet fuel, is starting to show signs of weakness. We expect range-bound trading with increased volatility and abnormally large headline risks.
3 / Past performance of major financial assets
Total return of major financial assets year-to-date and past month
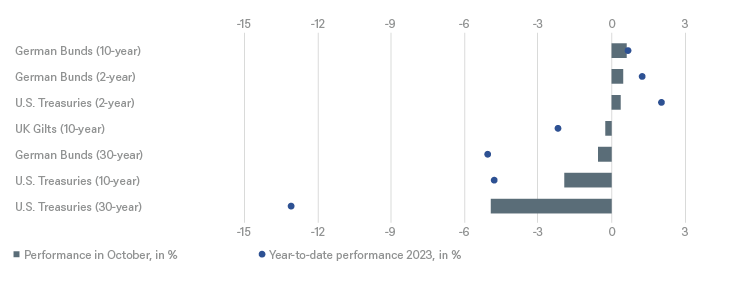
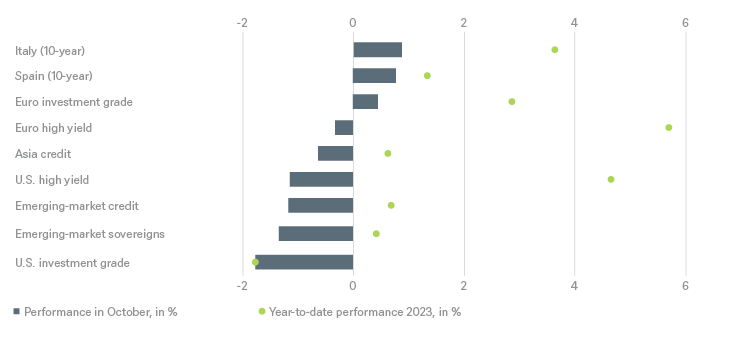
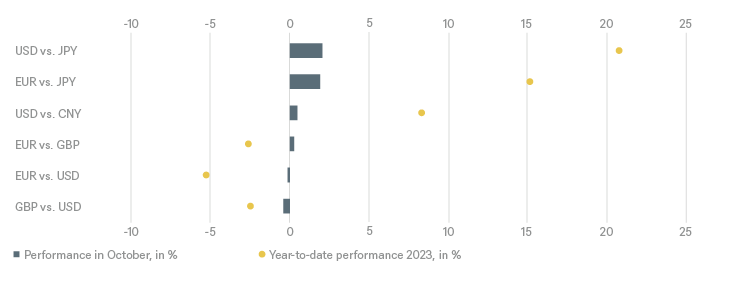
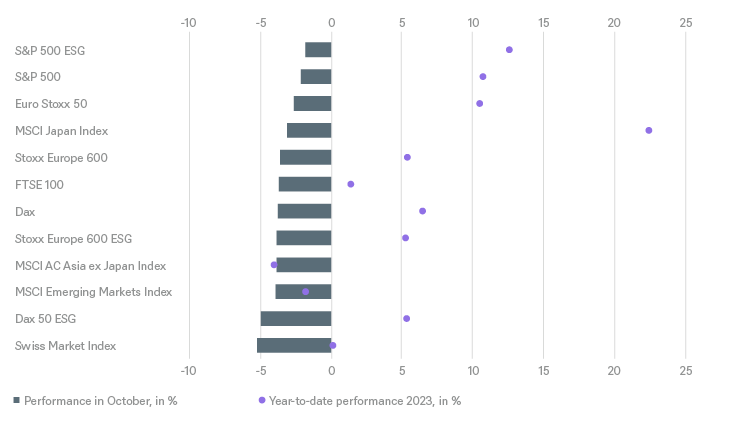
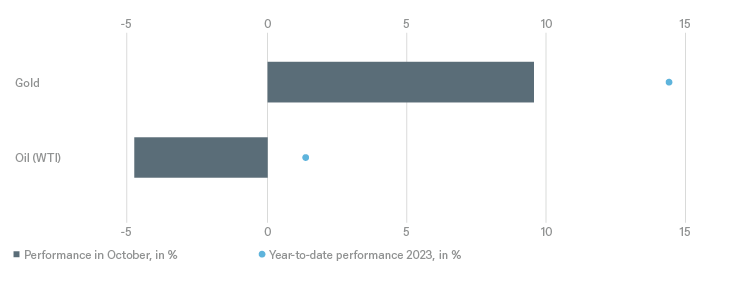
Past performance is not indicative of future returns.
Sources: Bloomberg Finance L.P., DWS Investment GmbH as of 10/31/23
4 / Tactical and strategic signals
The following exhibit depicts our short-term and long-term positioning.
4.1 Fixed Income
Rates |
1 to 3 months |
until Sept 2024 |
|---|---|---|
| U.S. Treasuries (2-year) | ||
| U.S. Treasuries (10-year) | ||
| U.S. Treasuries (30-year) | ||
| German Bunds (2-year) | ||
| German Bunds (10-year) | ||
| German Bunds (30-year) | ||
| UK Gilts (10-year) | ||
| Japanese government bonds (2-year) | ||
| Japanese government bonds (10-year) |
Spreads |
1 to 3 months |
until Sept 2024 |
|---|---|---|
| Spain (10-year)[2] | ||
| Italy (10-year)[2] | ||
| U.S. investment grade | ||
| U.S. high yield | ||
| Euro investment grade[2] | ||
| Euro high yield[2] | ||
| Asia credit | ||
| Emerging-market credit | ||
| Emerging-market sovereigns |
Securitized / specialties |
1 to 3 months |
until Sept 2024 |
|---|---|---|
| Covered bonds[2] | ||
| U.S. municipal bonds | ||
| U.S. mortgage-backed securities |
Currencies |
1 to 3 months |
until Sept 2024 |
|---|---|---|
| EUR vs. USD | ||
| USD vs. JPY | ||
| EUR vs. JPY | ||
| EUR vs. GBP | ||
| GBP vs. USD | ||
| USD vs. CNY |
4.2 Equity
Regions |
1 to 3 months[3] |
until Sept 2024 |
|---|---|---|
| United States[4] | ||
| Europe[5] | ||
| Eurozone[6] | ||
| Germany[7] | ||
| Switzerland[8] | ||
| United Kingdom (UK)[9] | ||
| Emerging markets[10] | ||
| Asia ex Japan[11] | ||
| Japan[12] |
Style |
1 to 3 months |
|
|---|---|---|
| U.S. small caps[23] | ||
| European small caps[24] |
4.4 Legend
Tactical view (1 to 3 months)
The focus of our tactical view for fixed income is on trends in bond prices.Positive view
Neutral view
Negative view
Strategic view until September 2024
- The focus of our strategic view for sovereign bonds is on bond prices.
- For corporates, securitized/specialties and emerging-market bonds in U.S. dollars, the signals depict the option-adjusted spread over U.S. Treasuries. For bonds denominated in euros, the illustration depicts the spread in comparison with German Bunds. Both spread and sovereign-bond-yield trends influence the bond value. For investors seeking to profit only from spread trends, a hedge against changing interest rates may be a consideration.
- The colors illustrate the return opportunities for long-only investors.
Limited return opportunity as well as downside risk
Negative return potential for long-only investors


