
- After multiple decades of tepid growth and inflation, Japan has a number of positive potential catalysts that may help to escape the deflationary trap
- Structural challenges still remain, where economic reforms will depend on sustained positive wage pressures and consumption behavior that can help build a reflationary mindset
- The decline in Japanese unit labor costs over the past three decades now makes Japan internationally competitive and leaves flexibility for labor unions to negotiate higher nominal and real wages
- Pressure from Japan’s government and the Tokyo Stock Exchange should continue to shift Japanese corporate behavior toward improved shareholder return and profitability
1 / Japan: Escaping the deflation trap
1.1 Escaping the growth and inflation rut
For much of the past 30 years, Japan’s nominal growth has been effectively zero (see Figure 1), reflecting both a significant slowdown in the economy and negative inflation. This deflationary trap, characterized by a prolonged cleaning-up in the banking, corporate, and real estate sectors after the bursting of the asset price bubble in the early 1990s, poor labor cost competitiveness, combined with worsening demographic challenges—vis-a-vis a shrinking working age population, has created a challenging growth backdrop for Japan and its businesses.
Figure 1: Japan nominal GDP (Billions JPY), seasonally adjusted annual rate
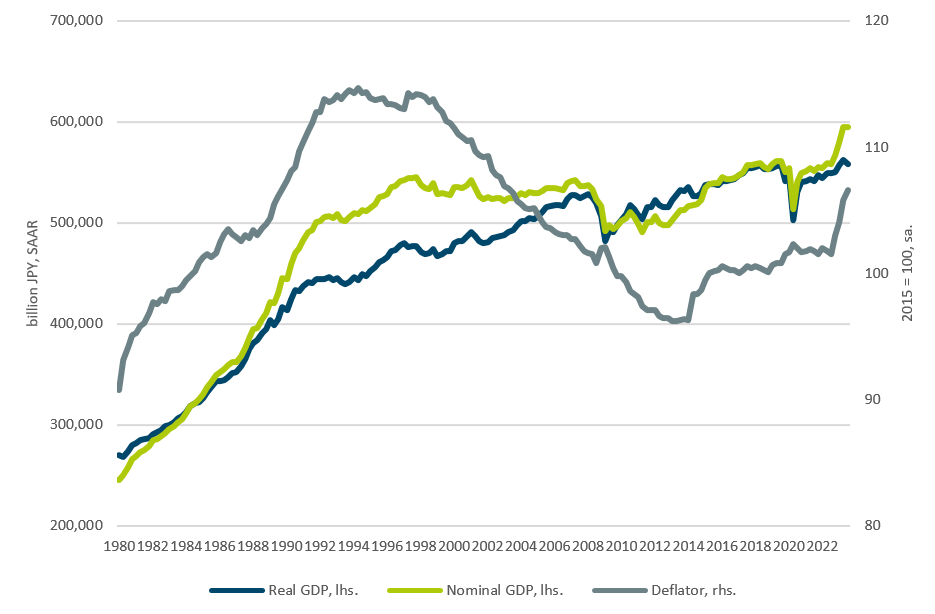
Source: Cabinet Office of Japan, Haver Analytics as of 12 December 2023.
As a consequence of persistent deflationary conditions, Japanese bond yields have moved significantly lower over the past three decades, with the 1-year sovereign bond yield not having exceeded 1% since the summer of 1995. Additionally, growing debt-to-GDP balances have necessitated low nominal risk-free rates, furthering the downward momentum in Japanese government bond (“JGB”) yields across the entire term structure and constraining the flexibility of monetary policy measures. Figure 2 illustrates this downward trajectory in both short and long-term yields in Japan over the past three decades.
Figure 2: Japanese government bond yields (%)
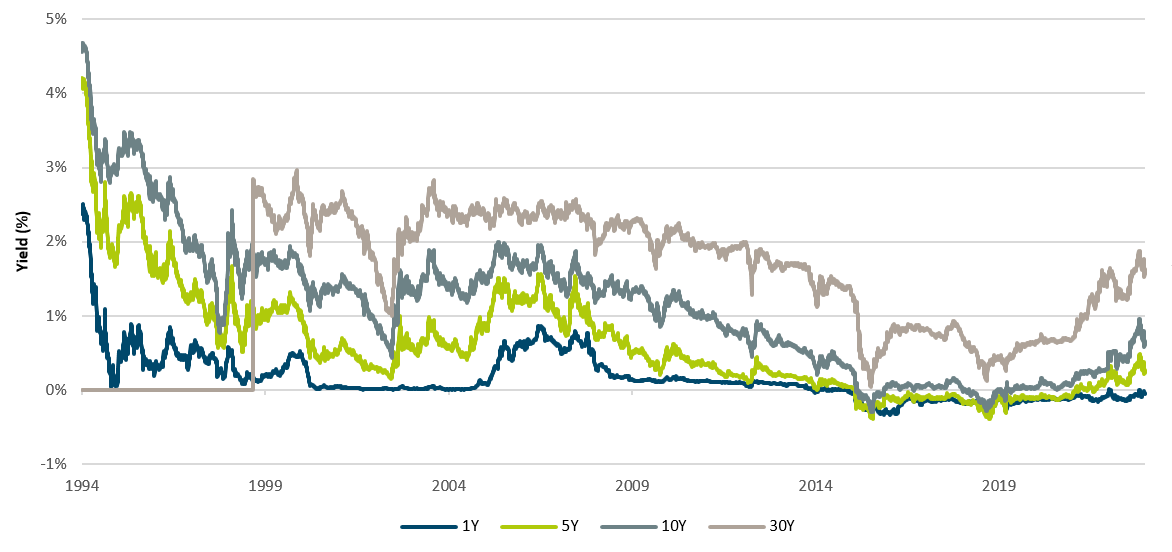
Source: Japan Ministry of Finance from 30 December 1994 to 27 December 2023.
In 2013, the eponymously named Abenomics—after Prime Minister Shinzo Abe, enacted several fiscal and monetary policies in a coordinated effort to accelerate growth and inflation. This included the switch to the ultra-expansive “quantitative and qualitative easing”, complemented by the negative interest rate policy in 2016, and an expansionary fiscal stance which has gradually led to today’s government debt of 250% of GDP. While initial reactions to the accommodative policies lifted investor optimism as well as economic and price momentum, this sanguine outlook quickly dissipated. Insufficient structural reforms played a role, as did the global economic environment that entered a period of low growth and disinflationary pressure.
1.2 Challenging demographics
As with other mature economies, Japan faces the prospect of further demographic challenges amid an aging population. Japan, however, arguably faces the greatest demographic headwinds, with a projected nearly 40% of the population expected to exceed retirement age by 2050.[1] With a median age of 48.6 years,[2] Japan currently ranks as the oldest country in the world, with the shrinking workforce population reflecting this worsening reality (see Figure 3).
Figure 3: Workforce population by age group (%)
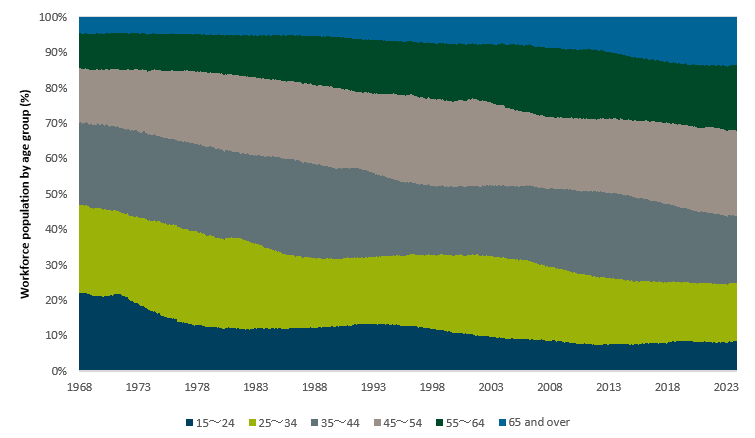
Source: Statistics Bureau of Japan as of 30 November 2023.
Despite a population that is both aging and shrinking, Japan has managed to in fact increase the number of employed people over the past two decades. In part, this reflects efforts since Abenomics to increase the labor market participation of women and elderly people. Further, the number of working immigrants has risen, albeit the overall level is still low.
Figure 4: Japan employed persons, (ten thousand)
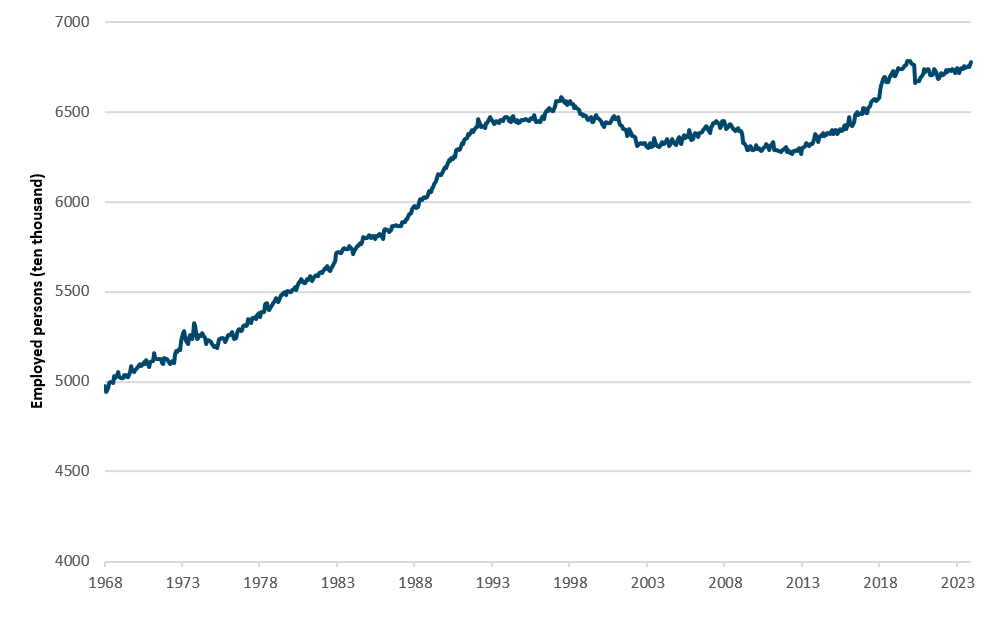
Source: Statistics Bureau of Japan as of 30 November 2023.
According to UN forecasts, the demographic challenges will intensify over the coming decades. Furthermore, the successful increase of the participation rate cannot be continued indefinitely. While effects of an aging population on inflation are unclear,[3] the scarcity of workers will likely support investments in labor-saving production methods and digitalization. At the same time, however, these demographic headwinds will keep the economy on a less dynamic growth path.
1.3 Building up “home-made” inflation
Recently, however, green shoots have emerged once again as inflation and nominal growth have reaccelerated (see Figure 1). The initial spark probably came from outside. The international turnaround in interest rates – while Japan stuckto its extremely expansive monetary policy – led to a yen depreciation of more than 20% since the beginning of the tightening cycle (see Figure 5).
Figure 5: Depreciation of the Yen has boosted inflation
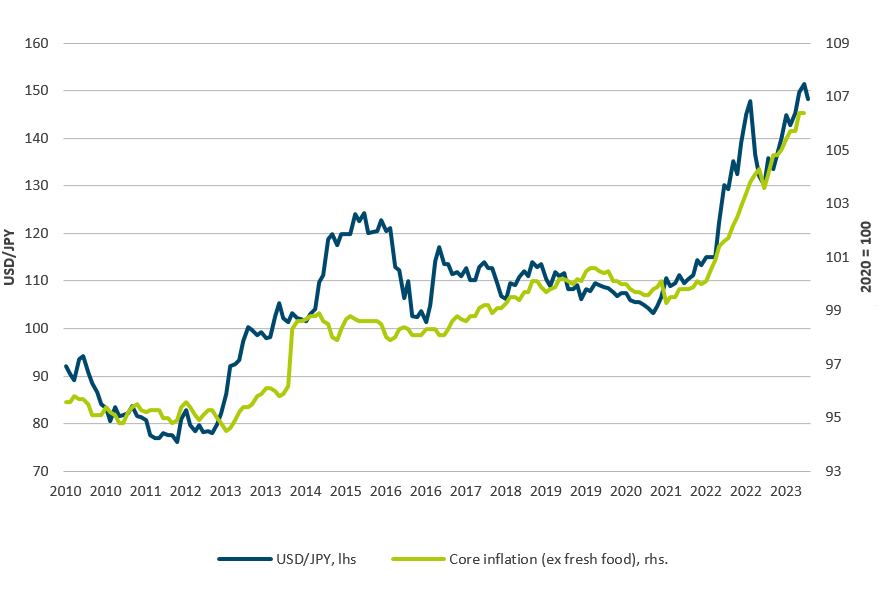
Source: Bank of Japan, Haver Analytics as of 12 November 2023.
The inflation surge caused by external costs rising has now spread into many domestic areas. Currently, 83% of items in the consumer price index basket are rising, approximately the highest share since the start of the time series in 2001. Surveys also point to an improvement in the price setting behaviour of companies. As households’ and companies’ expectations about wage and price increases shift, there is a realistic chance that inflation is back in the Japanese system, even if price dynamics will moderate towards 2%.
Figure 6: Domestically generated service price inflation takes over, YoY (%)
Source: Bank of Japan, Haver Analytics as of 28 December 2023
2 / Overcoming the lost decades
2.1 Improvement in global competitiveness…
A legacy from the boom time before the bursting of the asset price bubble was that Japan’s unit labor costs exceeded those of its developed market peers considerably. To a certain extend, the painful adaptation process over the last decades, characterized by real wage stagnation and a de-leveraging of the corporate sector, was necessary to regain international competitiveness. Japan’s average cost of labor per unit of output produced is now, for the first time in modern history, more competitive versus the U.S., Germany, and the UK (see Figure 7).
Figure 7: Competitive unit labor costs
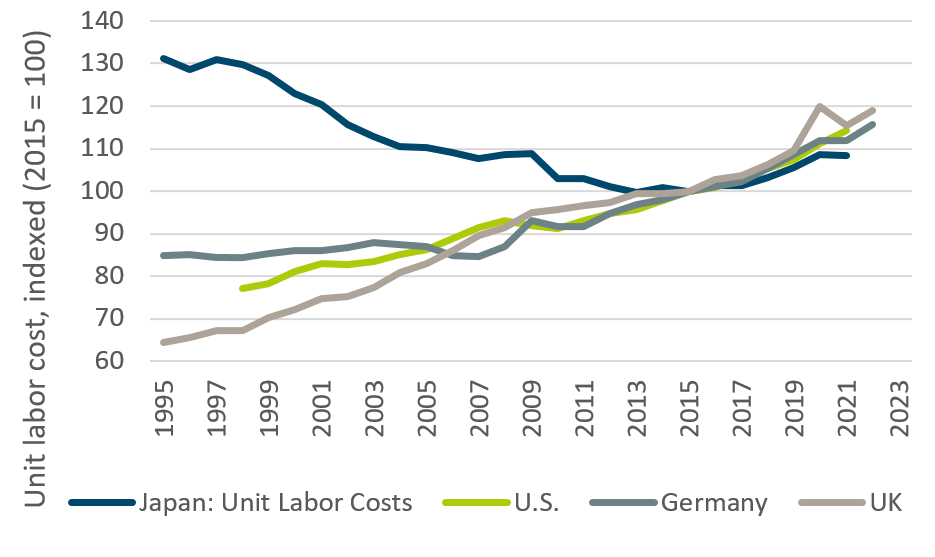
Source: OECD, Haver Analytics as of 28 December 2023.
2.2 … with positive domestic implications
The real wage losses described above have weighed on consumption and fuelled deflation. Now that these adaptation processes seem to have come to an end, improved labor cost competitiveness has provided a backdrop for real wage growth. Over the past two years, scheduled cash earnings for employees appear to have moved toward a higher equilibrium level of above 1% as shown in Figure 8.
Figure 8: Higher employee cash earnings
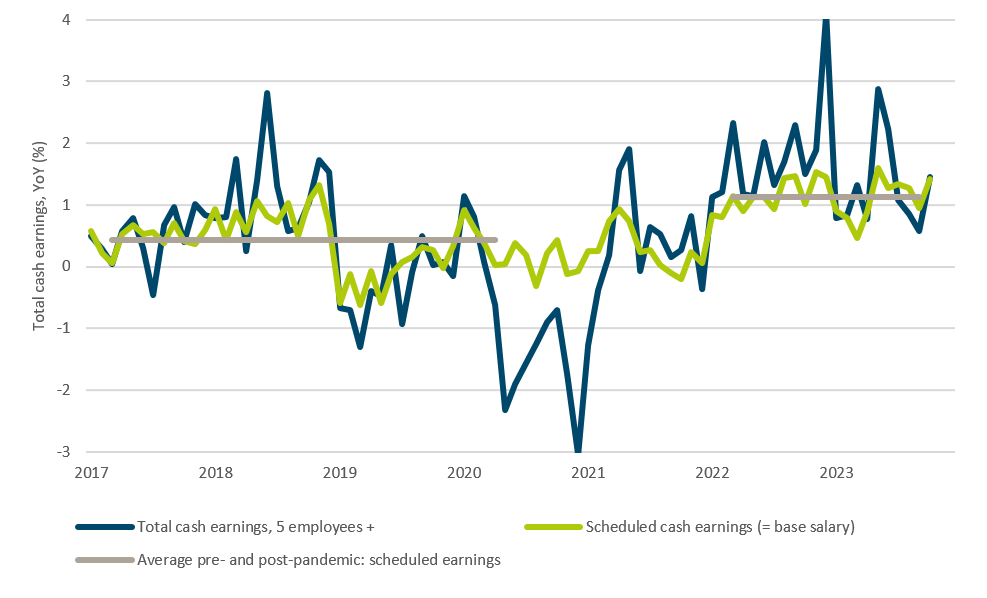
Source: Ministry of Health, Labor and Welfare, Haver Analytics as of 28 December 2023.
This is not yet enough to create the virtuous circle from income to spending that the Bank of Japan (“BoJ”) is eagerly awaiting, but it is a start. More evidence of increasing wage pressure comes from the annual Shunto wage negotiations. The national labor association RENGO has announced it will demand a total wage increase of more than 5% in the spring 2024 negotiations (see Figure 9). While last year’s wage increase of 3.6% - the highest in 30 years - failed to exceed the 4% realized inflation level, thus resulting in a minor decline in real incomes, even a more moderate outcome from this year’s wage negotiations should have a positive effect on real wages as global inflation slows.
Figure 9: Shunto negotiations show progress
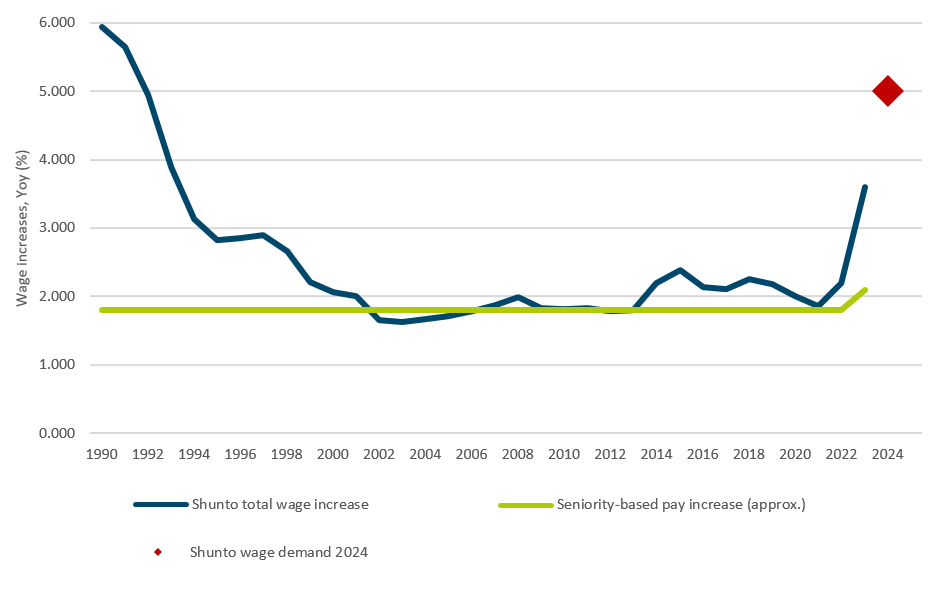
Source: Ministry of Health, Labor and Welfare, Haver Analytics as of 28 December 2023.
2.3 Corporates have re-organized
Parallel to lengthy cost cutting processes at home, Japanese companies have also strategically set up production facilities abroad.[4] Outbound driven foreign direct investments (FDI) have strongly increased over the last years, albeit from low levels (see Figure 10)
Figure 10: Higher outbound direct investments
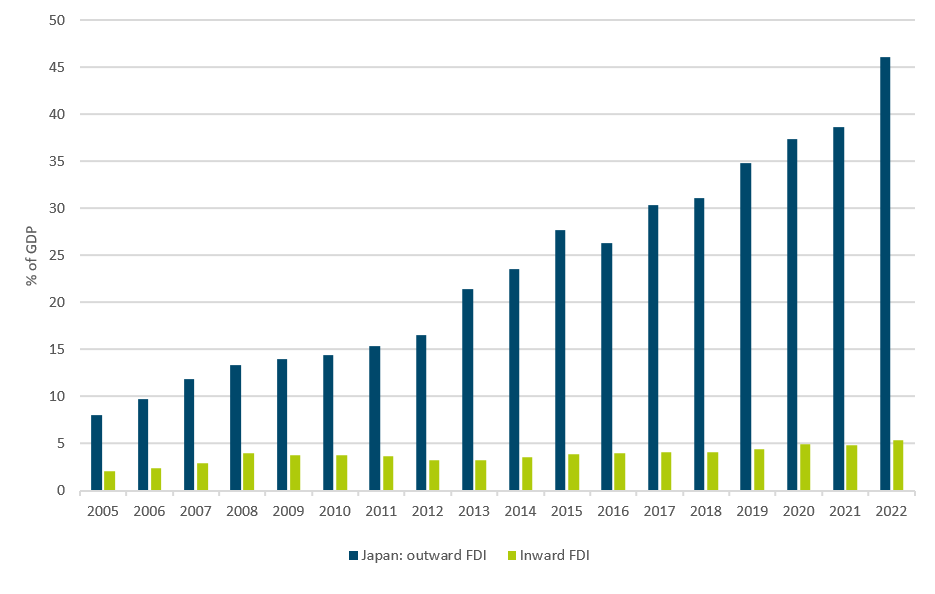
Source: OECD, Haver Analytics as of 12 December 2023.
The primary motivation for these foreign investments was likely to exploit labour cost advantages and diversify supply chains. However, these investments are likely to also open up sales markets in attractive destination markets with higher demand growth than domestic Japan. Investments are focussed on high-growth Asia.
2.4 Potential drivers for economic reflation
While the return of inflation has pushed nominal growth for the first time in 30 years, real domestic investment having lagged in recent quarters (see Figure 11).
Figure 11: Domestic investment must accelerate
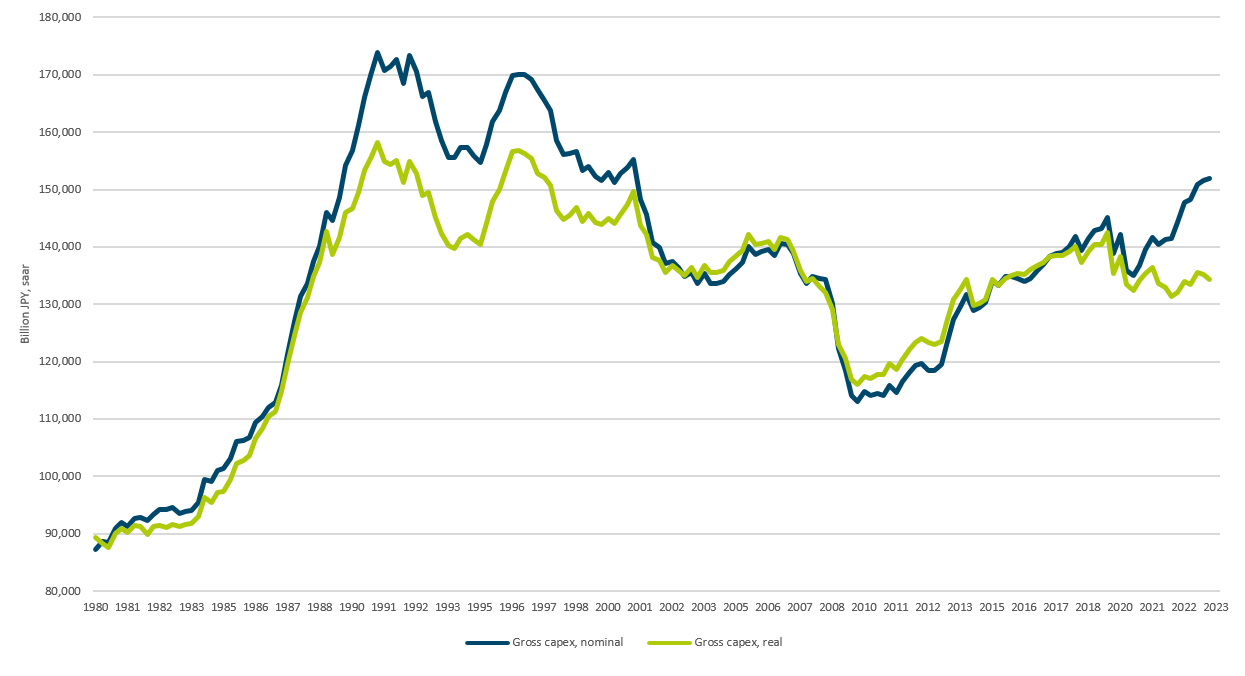
Source: Cabinet Office of Japan, Havaer Analytics as of 12 December 2023.
However, besides structural factors that should support higher investments, labor shortages could necessitate higher capital expenditures in order to meet demand. Structural issues like decarbonization needs to be financed, and the current combination of an extremely expansive monetary policy plus higher inflation rates has led to deeply negative interest rates which should spur investments as well.
Though the BoJ is likely to end its negative key interest rate policy in 2024, when it becomes sufficiently convinced that the reflationary process is more of a permanent nature, it will act very cautiously and gradually. This implies that the negative real rates environment, as painful as it is for savers, will continue to support investments.
Figure 12: Favorable environment for investments
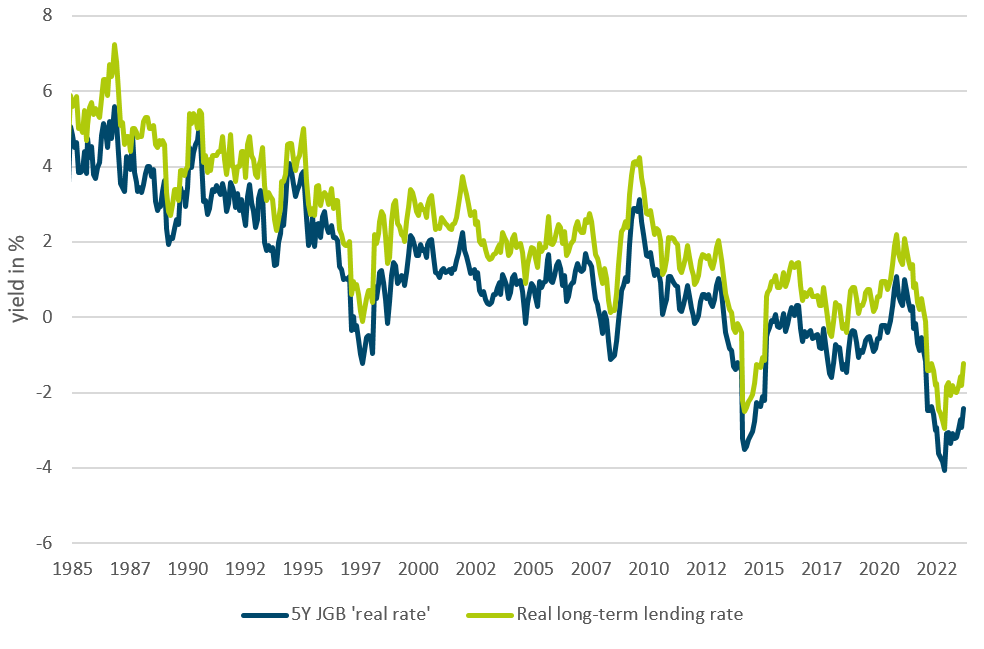
Source: Ministry of Internal Affairs and Communications, BoJ, Haver Analytics as of 28 December 2023.
Sustained positive real wage momentum combined with required increases in capital expenditures could help to improve what has been otherwise slow productivity growth. The BoJ’s expectation of a moderate rise of the potential growth rate, currently estimated to be at around 0.5%, seems plausible.
2.5 Strategic positioning in international trade
At a time of global trade wars and a retreat from globalization, Japan has chosen to integrate itself even more deeply into international trade. It is not only via FDI activities that Japan has positioned itself well in the Asian region. It also decided to consistently join the major trade agreements of the last years.
Among the biggest is the CTPP (Comprehensive and Progressive Agreement for Trans-Pacific Partnership), the successor of the TPP, from which the U.S. withdrew under President Trump. Further, Japan also joined the RCEP (Regional Comprehensive Economic Partnership), that focuses on Asian trade and includes China. Both trade arrangements lead to lower non-tariff and tariff barriers and should foster regional trade and a deeper integration especially in the Asian Pacific region. It shows that Japan has decided against international compartmentalisation and trusts its companies to withstand global competition. Japan’s current trade openness comparatively provides further room for growth (see Figure 13), we expect the effects to become visible in the longer term.
Figure 13: Trade openness
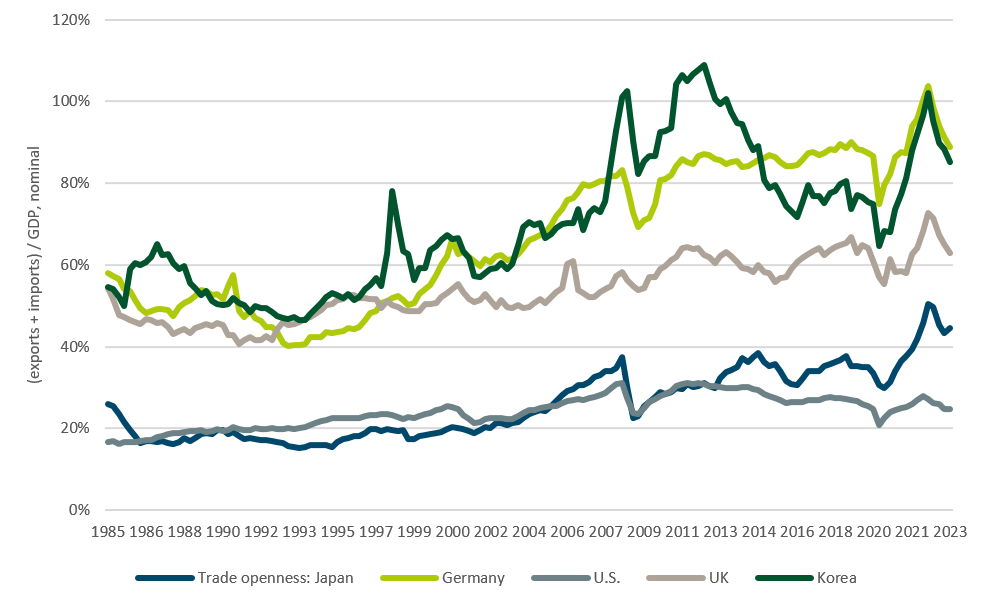
Source: Respective central banks, Haver Analyticsas of 12 December 2023.
2.6 Central bank policy
After seven years of yield-curve control (YCC), the Bank of Japan has begun to reintroduce flexibility around the Japanese treasury bond yields, allowing increased market determination as to the fair value of medium-to-long-term interest rates. The BoJ has already changed the binding ceiling for the 10-year JGB yield into a more loose reference band since October 2023. Markets are expecting this to be the direction of travel given a backdrop of more persistent inflationary pressures that could put upward pressure on nominal yields.
Figure 14: Short end stuck in negative territory
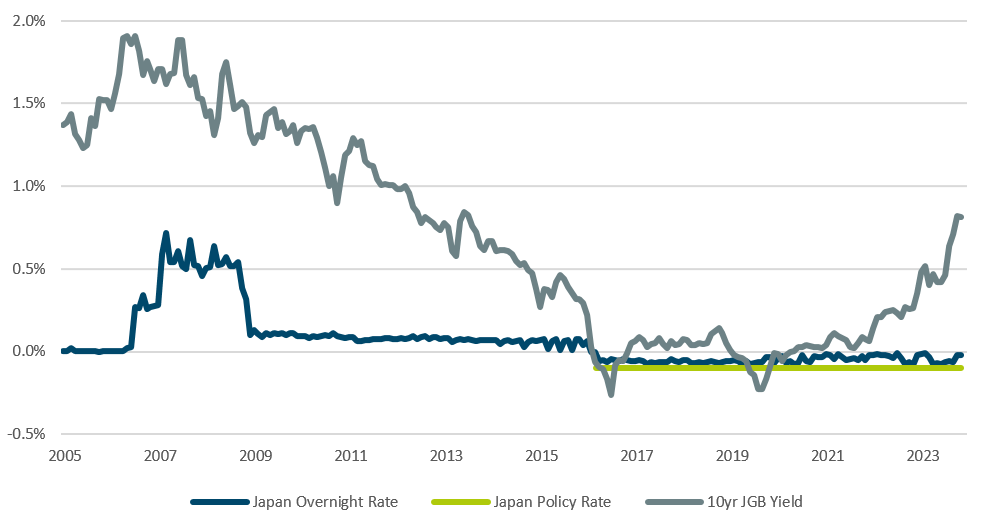
Source: Bank of Japan, Haver Analyticsas of 28 December 2023.
To pivot back toward a more flexible treasury yield environ-ment, the BoJ must gradually manage down its dominance of the JGB market (see Figure 15), where it currently makes up over half of the current holdings. Furthermore, high debt-to-GDP balances both in absolute terms and relative to other countries increases the net interest sensitivity of Japan’s treasury to significant increases in real interest rates. The question of fiscal dominance is therefore certainly even more pressing in Japan than in other countries, where debt ratios have also risen since the pandemic. This is certainly an im-portant reason to expect the BoJ to act very cautious in the future.
Figure 15: BoJ ownership of JGBs (%)
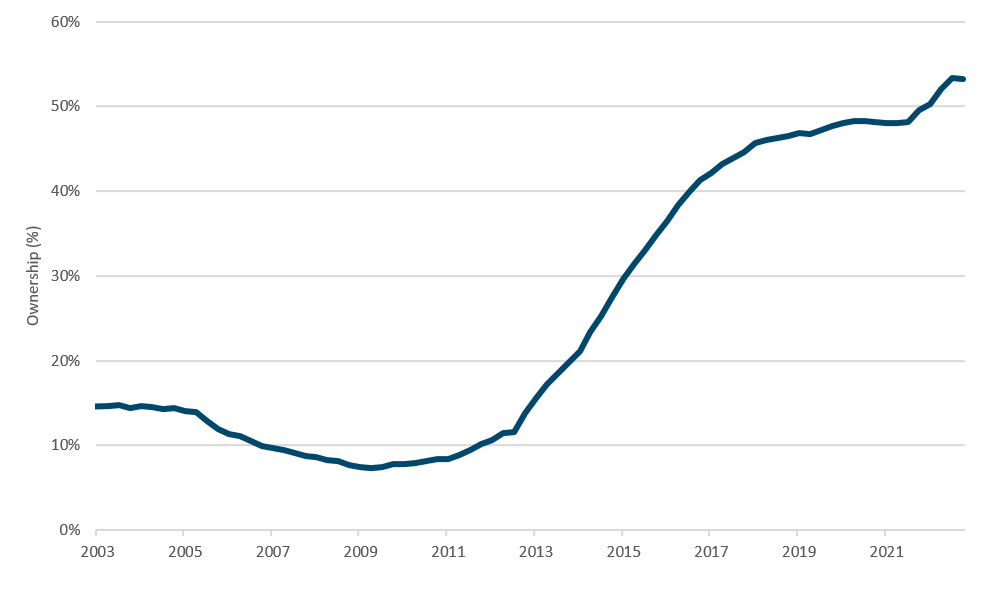
Source: Bank of Japan, Bloomberg Finance L.P. as of 30 September 2023.
Nonetheless, moving away from YCC in light of positive developments in economy and price reflation can be viewed as a broadly positive signal to investors. It marks a first step towards a gradual and cautious normalization of monetary policy. As inflation is becoming more entrenched and the economy seems likely to expand above its growth potential at least this year and next, the BoJ is also becoming more and more confident that it can eventually achieve its price stability target of 2%. The central bank’s medium-term CPI forecasts have recently been revised upwards (see Figure 16).
We expect the BoJ to end its Negative Interest Rate Policy NIRP around spring/summer 2024. From a macro perspective, it is essential that key indicators such as a positive output gap, domestic price momentum, and rising wage dynamics remain on track. The aforementioned structural improve-ments in the economy, which have been taking place more in the background and are of a long-term nature, can certainly flank the long hoped-for path out of deflation.
Figure 16: BoJ inflation forecasts: higher conviction
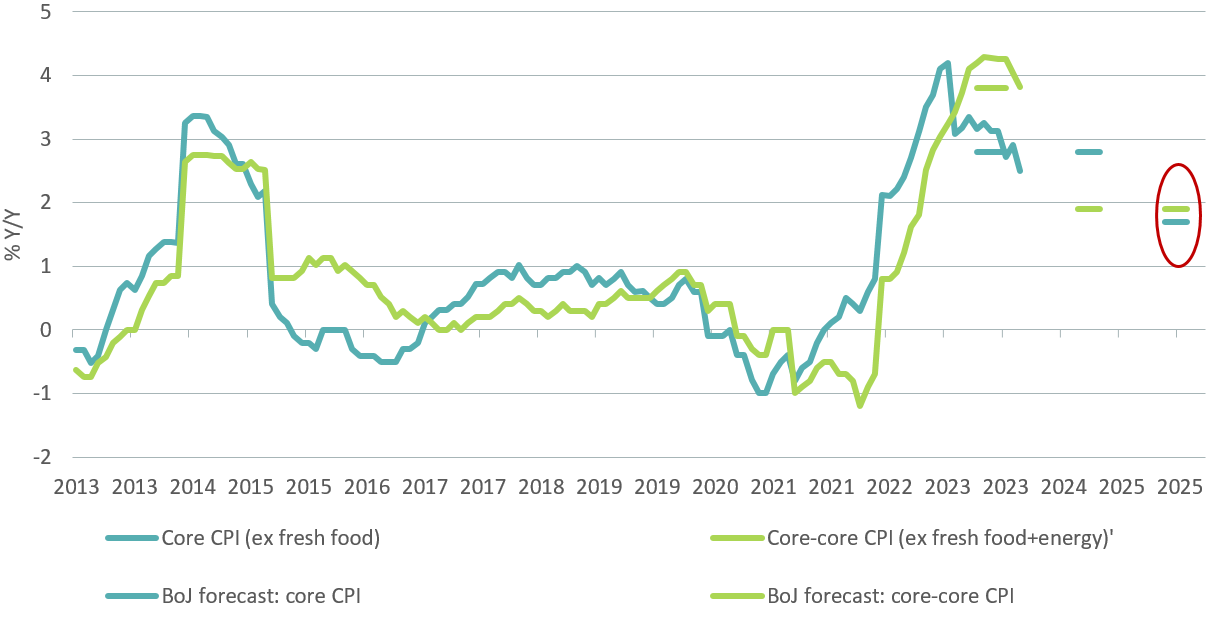
Source: Bank of Japan, Haver Analytics as of 28 December 2023.
3 / Improving shareholder return
3.1 Breaking down the strategic return outlook
When evaluating strategic asset weightings across equity markets, Japan looks noticeably low as compared to other equity markets. Primarily, lower levels of potential inflation and real earnings growth (derived from economic growth) limit the contributing factors to the 10-year nominal return outlook (see Figure 17).
Figure 17: Comparison of MSCI Japan and MSCI World-ex Japan 10-year forecasted hypothetical annualized returns
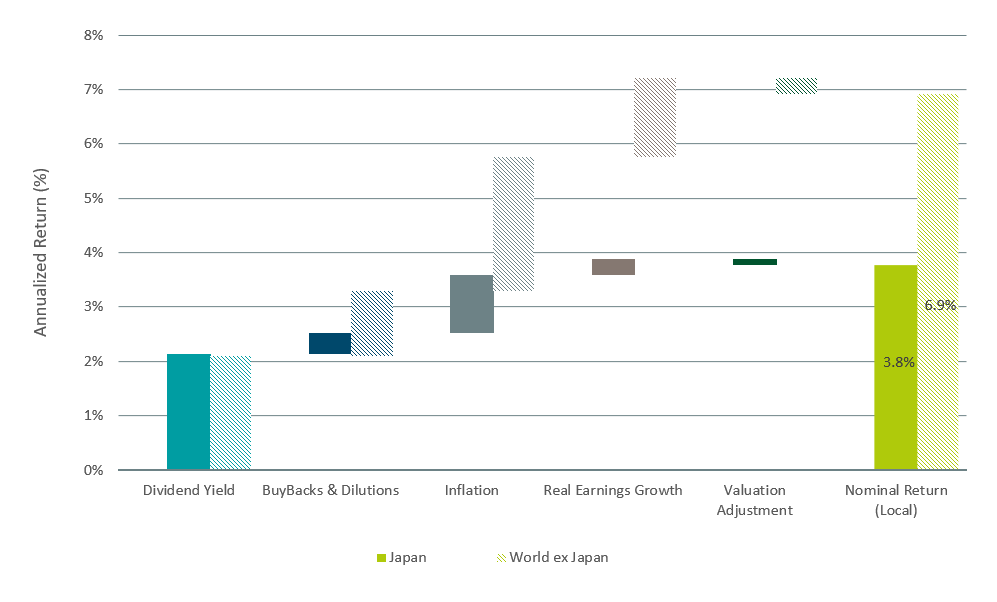
Source: DWS Investments UK Limited. Data as of 30 Sep 2023.
While lower top-line growth potential is an unavoidable reality in Japan given the current demographic trends, the potential for reflationary pressures could help to stimulate real earnings growth beyond current levels. Still, in order to bridge this gap in potential returns between Japanese equi-ties and other regional equity markets, Japanese corpora-tions must become more friendly to shareholders as to war-rant more structural foreign investor appetite. Already, a number of reform measures have been enacted in an effort to improve profitability and justify higher structural valuations.
3.2 Corporate reform measures
Since the initial Abenomics reform measures in 2013, Japanese corporations have been pressured to increase their shareholder value through a variety of corporate reform measures. Beginning in 2013 with the ratification of Japan’s Stewardship Code, which laid out a framework to “promote sustainable growth of companies through investment and dialogue”, companies have been pressured to return capital to shareholders in an effort to improve cash returns. Over the past decade, we’ve observed buybacks in Japan climb gradually, with record figures thus far in 2023 (see Figure 18).
Figure 18: TOPIX cumulative buyback number (Oct-Nov, Jul-Nov)
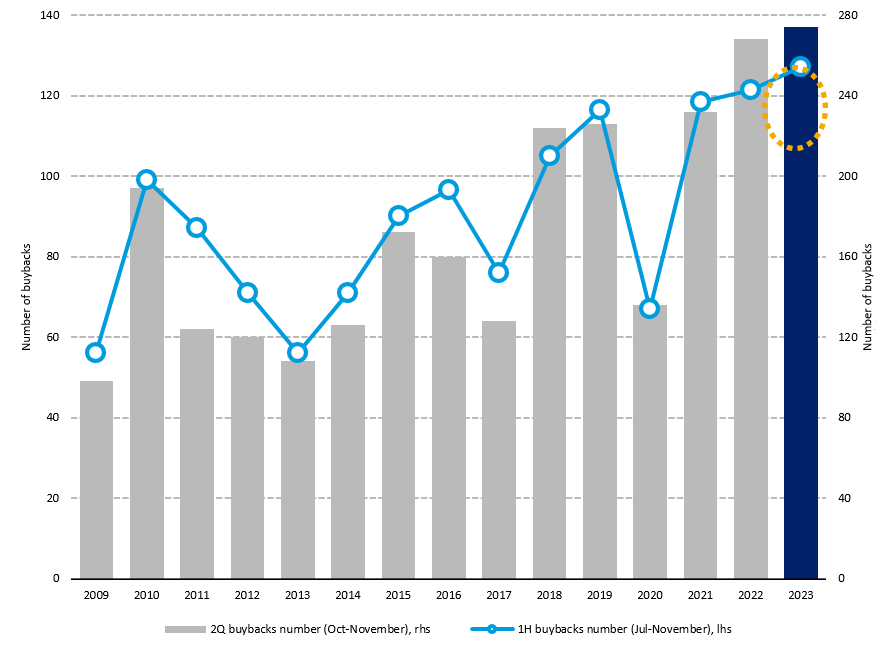
Note: Share buybacks are aggregated from Jul-Nov, Oct-Nov for each fiscal year.
Source: BofA Global Research, QUICK as of 15 November 2023.
This improvement in capital efficiency, along with strong foreign revenue exposures, has created positive earnings momentum for Japan’s stock market since 2013. Figure 19 shows the Nikkei 225 earnings per share on a trailing 12-month basis since 2004.
Figure 19: Nikkei 225 earnings per share (TTM)
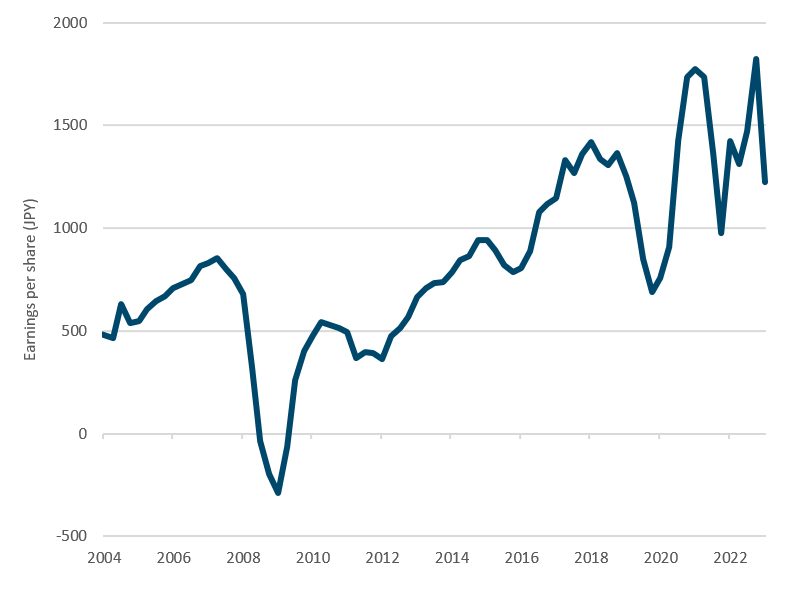
Source: Bloomberg Finance L.P.as of 31 December 2023.
Pressure from Japan’s government and from the Tokyo Stock Exchange (“TSE”) in more recent years has put the spotlight on companies that have realized poor valuations, with companies trading with a price-to-book (P/B) ratio below 1[5] (where a P/B of 1 is viewed as the liquidation value of the company) being asked to plan and announce measures to improve the valuations of their businesses by increasing shareholder friendliness. Up to this point, valuations across the Nikkei 225 still look quite poor, with nearly 45% of the index still trading at a below a 1x P/B (see Figure 20).
Figure 20: Share of Nikkei 225 trading below 1x P/B (%)
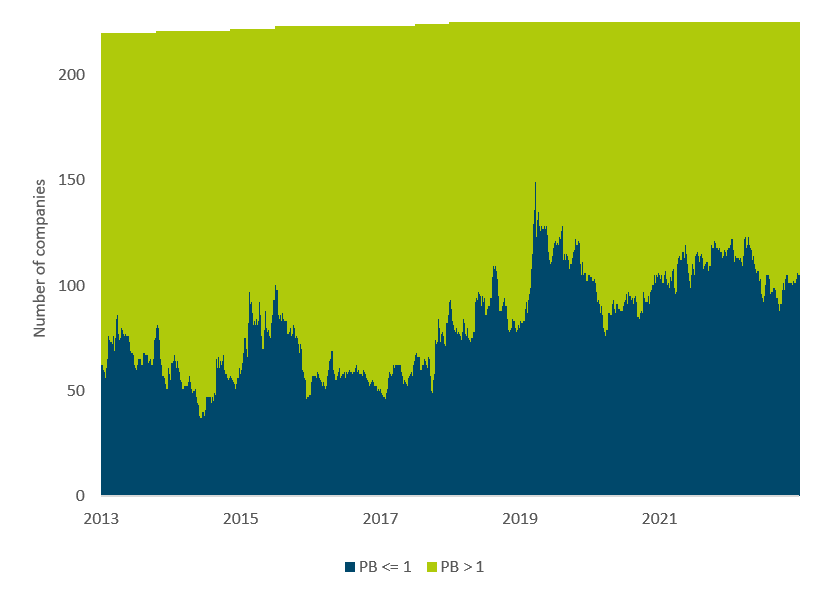
Source: Bloomberg Finance L.P. as of 31 December 2023.
Particularly as inflation pressures have seemingly returned, the transmission of a reflationary economy to corporate pricing power may provide a structural tailwind to Japanese corporations. While necessary price hikes on goods and services have thus far been met with negative consumer sentiment, a shifting mindset toward the acceptance of gradually increasing prices in conjunction with more favorable wage growth may provide the necessary basis for Japan companies to improve their top-line growth.


